Last Chapter
Next Chapter
3. Active Control of Subglottal Pressure in Plosive Production by Changes in Respiratory Muscle Innervation
3.1 Some General Considerations in the Study of Subglottal Pressure
By definition, a plosive is produced with a fairly strong subglottal pressure. This pressure is normally positive. The pressure is preceded and followed by other pressures that may be, in general, quite different from it, depending on the phonetic environment, stress pattern, and breathing pattern. This chapter and the succeeding chapter are primarily concerned with the characteristics of the variation of subglottal pressure in the production of simple-released-plosives.
There are three mechanisms that might cause significant variations of subglottal pressure in plosive production:
(1) Subglottal pressure can be varied by changes in the pattern of innervation of the muscles of respiration.
(2) Variations of subglottal pressure may be caused by variations in the glottal-supraglottal resistance (or, equivalently, in the rate of air flow). In plosive production the main variations of glottal-supraglottal resistance occur at the closing of the articulators and the articulatory release.
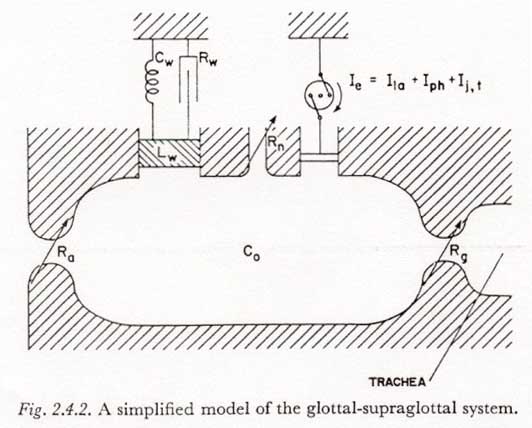
(3) If the glottis is partially open during a period of articulatory and velopharyngeal closure, changes in the supraglottal cavity volume (Ie in Figure 2.4.2) may produce changes in subglottal pressure.
The variations of subglottal pressure caused by changes in glottal-supraglottal resistance or in supraglottal cavity volume (2 and 3 above) can be thought of as passive responses resulting from the processes of articulation and phonation. In Chapter 4 we will consider the extent to which subglottal pressure is affected by these factors in simple-released-plosive production when a constant respiratory muscle innervation is assumed.
In the remainder of this chapter we will consider the active control of subglottal pressure by the muscles of respiration (1 above) in plosive production. Data will be presented from supraglottal pressure measurements (Sections 3.3, 3.4 and 3.7), from model studies of the physical dynamic properties of the respiratory mechanism (Sections 3.5 and 3.8), and from a survey of the pertinent literature concerning the mechanism of muscle contraction (Section 3.6). Certain concepts and definitions concerning the underlying patterns of neural innervation of the respiratory muscles will be discussed briefly (mainly in Section 3.7).
A primary objective in this chapter is to estimate the dynamic constraints in the active control of subglottal pressure in plosive production and, to the extent possible, to trace these constraints to the underlying physical and physiological mechanisms. Though some limited and tentative conclusions can be reached, it should be emphasized that this chapter considers a set of relationships in which some of the important data are yet to be measured and some of the underlying concepts are yet to be developed.
3.2 Active Control of Subglottal Pressure in the Simple-Released-Plosives
There are a number of idiosyncratic characteristics of the subglottal pressure patterns associated with simple-released-plosives. These various characteristics will be discussed in the present section.
The peak subglottal pressure during a simple-released-plosive may be expected to equal or exceed (i.e., not be appreciably less than) the peak pressures which precede and follow. Though there is only limited statistical evidence to support this view, it is, in fact, a necessary consequence of the definition of the simple-released-plosive; that is, it is necessary that there be a buildup of sufficient subglottal air pressure to produce an acoustically significant release. In this chapter we will therefore be concerned primarily with the ability of the respiratory mechanism to produce a sudden increase in subglottal pressure before the release.
It will be convenient in this work to distinguish two idealized types of subglottal pressure increases from a preexisting quasi-steady-state pressure:
(1) The increase may be to a new, higher level of pressure which is approximately maintained for an appreciable interval of time. This type of change will be referred to as unidirectional.
(2) The increase may be followed closely by a comparatively large decrease. When the decrease follows closely enough after the increase that the entire change may be considered as one action, the total pattern of variation will be referred to as cyclic. The borderline between a cyclic and a unidirectional change will be discussed further in Section 3.7. The terms 'unidirectional' and 'cyclic' will be profitably used in later chapters for aspects of a motor process other than a pressure variation (a laryngeal movement, for example).
In Sections 3.3 through 3.6, only a unidirectional change of pressure will be discussed explicitly. The concept of a cyclic change will be reintroduced in Section 3.7.
Another important characteristic of the production of a plosive is the significant period of little or no transglottal air flow. Much or all of any pre-release pressure increase for a plosive is attained during a period of essentially no air flow. The variation of subglottal pressure during this interval thus almost entirely reflects the action due to innervation of the respiratory mechanism. This formation appears to be significantly simpler than the more general case in which subglottal pressure changes may be produced during periods of high or rapidly changing transglottal air flow.
3.3 Some Relations Between Subglottal and Supraglottal Pressure During the Articulatory Closure
An incidental advantage in the study of subglottal pressure regulation during plosive production is that if the glottis is open during a period of articulatory and velopharyngeal closure, the supraglottal cavity pressure can often be considered equal to the subglottal pressure. Therefore, for many types of plosives, the subglottal pressure can be measured accurately during most or all of the period of articulatory closure with a pressure transducer coupled to the supraglottal cavity.
There are a number of conditions under which caution must be taken in assuming that the supraglottal pressure record directly reflects the subglottal pressure during a period of articulatory closure. The obvious case of the voiced plosive will be discussed in detail in Chapter 7. The effect of velopharyngeal leakage in an unvoiced closure will not be considered, but might be a factor when the plosive is preceded by a nasal, or in the presence of certain speech defects.
Another possible cause of error in estimating subglottal pressure from supraglottal measurements occurs when there is a change in the supraglottal cavity volume. With a complete articulatory closure and no velopharyngeal leakage, the difference between supraglottal and sugblottal pressures is equal to (Ie � Rg). Assuming a value for Ie of 0.2 1/sec, as might be present during active pharyngeal expansion1 or certain rather extreme articulatory movements, even a rather open glottis with a resistance of 3 Ohms will result in a transglottal pressure drop of 0.6 cm H20. Higher glottal resistances of, say, 10 to 20 Ohms, which might occur if the glottis was in a state of transition to or from the closed state, would result in proportionately higher transglottal pressure drops, i.e., 2 to 4 cm H20.
From these figures, it appears that even the smaller values of Ie which one might expect from the average articulatory movements or the opening and closing gesture for the plosive may cause a transglottal pressure drop of as large as 1 cm H20 if the glottis is narrow, as during a transition to or from the closed state. A narrow glottis in transition to a closed state might be expected during the period of articulatory closure in an unvoiced, unaspirated simple-released-plosive which is followed immediately by a voiced continuant. This condition occurs, for example, in the unvoiced, unaspirated canonical allophones found in Korean, as discussed in Sections 6.5 and 6.6 below. In fact, in such plosives a rapid change of supraglottal pressure just before the release can be taken as an indication of an approximation or closure of the true vocal folds. However, the above computations show that without a knowledge of the rate of change of supraglottal cavity volume, one may not be able to tell from the supraglottal pressure waveform whether the vocal folds are completely closed or just closely approximated.
3.4 Some Measurements of Subglottal Pressure Rise Time
To obtain an initial estimate of the constraints on the time constant of subglottal pressure increase, measurements of this time constant were made from records of the supraglottal pressure during the production of initial unvoiced plosives in Korean and Hindi, as spoken by adult native speakers of those languages. A female speaker of Korean and a male speaker of Hindi were used. The recordings were made in these languages because of certain other properties of interest which will be discussed in later chapters. (Most of the pressure records were from Korean because the plosives of most interest in Hindi are voiced and very few unvoiced samples from this language were recorded.)
For the Korean samples, words2 with initial bilabial plosives were read from a list at a comfortably fast rate. In this mode of reading, it appears that most subjects will relax the subglottal pressure between words, and usually even produce a negative pressure to restore lung volume. Therefore an initial plosive will invariably be produced with a rise of subglottal pressure during the period of articulatory closure. By encouraging a rather fast reading (or, rather, discouraging excessively slow reading) it was hoped to get subglottal pressure buildups having rates that approach, in some instances, the capacity of the respiratory system.
Most of the Hindi plosives were read in a list of short sentences (2 to 4 words) in which the plosive of primary interest occurred initially, in the first word of a sentence. All of the plosives referred to in this chapter were produced in this position. (Some plosive samples to be discussed in other chapters were produced intervocalically and/or in isolated words included in the list.) Here again the normal breathing pattern involves the restoration of lung volume between sentences and a buildup of subglottal pressure during the closure of a sentence-initial plosive.
In both recordings, the supraglottal pressure of the bilabial plosives was measured with a strain-gage pressure transducer (Statham type PM 5) through a length of polyethylene tubing about 6 to 10 inches long inserted in the corner of the mouth. For the time constants of interest in this work the tubing had negligible effect on the system response, and the exact dimensions were not recorded. The signal from the pressure transducer was recorded simultaneously with the external sound pressure wave on separate tracks of an Ampex 300–4 tape recorder. (The Ampex machine which was employed records 4 tracks on 1/2 inch tape.) Sound pressure was measured with an Altec condenser microphone about 6" from the mouth and 30 degrees off center. Supraglottal pressure was recorded on the tape by amplitude modulating a 10 kHz carrier. Linearity of the modulation-demodulation system through the range of interest was monitored by recording a calibrated signal in place of the transducer output before each recording session. Fresh, high-quality tape was used to minimize the noise inherent in amplitude modulation on magnetic recording tape. In addition, the pressure signal was recorded on two channels with relatively independent noise characteristics (1 and 4), to allow a crosscheck of suspect variations in the curves. With these precautions, there were few noise-induced variations which were not clearly identifiable. Curves were ‘read-out’ on a Mingograph ink-jet recorder, including the calibration signals (in this way the linearity of the Mingograph recorder was also checked). The response time of the entire system was determined primarily by the pressure transducing system and was about 7 to 10 msec.
The subjects were instructed to speak at a “normal conversational level” (monitored by the experimenter), except that the Korean speaker was instructed during two of the four recorded repetitions of the list to use a “louder” voice level. No attempt was made to monitor the increase in loudness. The subjects practiced the lists a number of times before the recordings were made. They were not aware of which readings of the list were recorded.
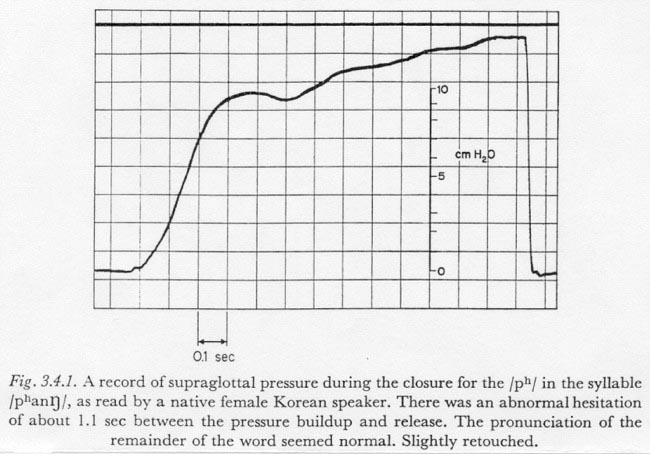
To facilitate the comparison of the rise times of curves of somewhat different shapes, a simple measure of rise time, or time constant, was defined which is suited to the type of curve found when fast increases in subglottal pressure occur. Figure 3.4.1 shows an increase in subglottal pressure that has a shape rather characteristic of those pressure increases which can be described by a single time constant. This record was obtained by measuring supraglottal pressure during the production of the syllable /pha[ng]/ by the speaker of Korean. The speaker apparently hesitated before the release, and held it long enough for the subglottal pressure to reach its 'ballistic' maximum during closure. (The use of the term 'ballistic' in this regard will be discussed below in Section 3.7.) The increase has a rather symmetrical “S” shape with a fairly long period during which the increase is at or near the maximum rate. In this chapter such a curve will be characterized by its maximum rate of increase and by its asymptotic total increase. More specifically, we will define the time constant of a simple change in pressure (having one predominant time constant) as follows:
| total change (cm H20) | |
|
time constant (sec) = |
____________________________ |
| maximum rate of change (cm H20/sec) |
The above described type of curve can also be characterized by the time for the increase in some central region, as the time between 1/10 and 9/10 of the total increase. For most simple subglottal pressure increases this latter definition would result in a number very close to the number resulting from the former definition specified above.
For the record in Figure 3.4.1 the time constant of the initial increase is about 190 msec.
Most of the other samples of subglottal pressure increase obtained in the manner described above were interrupted by an articulatory release before the hypothesized ballistic maximum was reached. However, by judiciously projecting such curves to an apparent asymptotic maximum, a fair estimation of the time constant could often be obtained. Such projections were made only when it seemed that they could be within about 25 % of the maximum subglottal pressure that would be attained if the release had not occurred so soon.
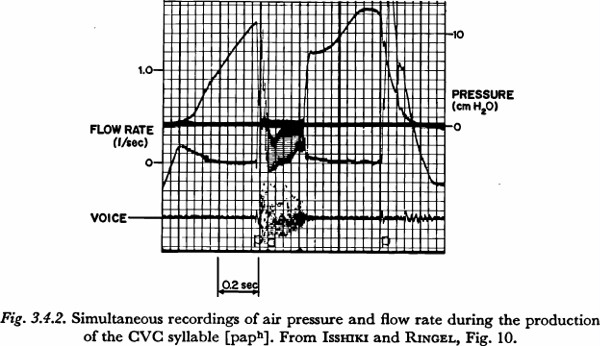
When a brief, faster-rising initial phase was present, it was taken to indicate a period during which the articulators were closing, but not yet sealed. The rate of pressure increase was measured from the subsequent, slower-rising segment. (When the initial phase was of considerable length, the time constant was not measured.) This condition is illustrated in Figure 3.4.2, which shows part of a record presented in a study of air flow by ISSHIKI and RINGEL (1964). The utterance [paph] was read in a list of similar CVC nonsense syllables, and the supraglottal pressure, the total air flow (through an external mask), and the speech pressure wave were measured simultaneously. The increase in pressure for the initial consonant begins with a faster-rising phase, having a duration of about 50 to 75 msec. The air flow pattern during the initial fast rise in pressure shows that the articulators are in the process of closing.
In seven cases for the Korean speaker and in two cases for the Hindi speaker, a time constant of pressure increase could be estimated using the above criteria. The values obtained were:
Korean: 190, 200, 240, 250, 270, 280 msec;
Hindi: 160, 180 msec.
Approximately an equal number of samples for each speaker were less clearly measureable, but had time constants in the same range.
In order to test for a lower limit of the time constant of pressure increase, the experimenter himself produced sequences of words and of short sentences, each beginning with an unvoiced bilabial plosive. He also attempted to produce sudden increases of subglottal pressure (of about 10 cm H20) with a bilabial and velopharyngeal closure and an open glottis throughout. Supraglottal pressure was measured as previously, and recorded directly on the Mingograph recorder. Amplitude calibration was accomplished (and linearity checked) with a static pressure source and water manometer.
In both types of experiments, time constants of as brief as, but not appreciably briefer than, 100 msec could be obtained. Some waveforms from this series, including one aberrant pressure increase with a time constant of 53 msec, will be discussed in Section 3.7.
Figure 3.4.2, presented previously, also contains an interesting indication of the approximate independence of the time constant relative to the magnitude of total pressure increase. As can be observed in the figure, after the articulatory closure for the final plosive of the syllable, the subglottal pressure was relatively constant at about 8 cm H20. In what might have been a somewhat artificial maneuver for a final plosive in an isolated CVC syllable, the speaker raised the subglottal pressure (a maximum of) 4.5 cm H20 before the release. The downturn of pressure just before the release appears to be the beginning of a drop to a negative, inspiratory pressure. Due to the fact that the increase was not initiated until the articulators were well into the period of closure, it is likely that the time constant of the pressure increase is at least fairly close to the minimum for this speaker under the given conditions. The time constant of the increase is about 160 msec. (However, the time constant of the increase during the initial closure is about 360 msec, perhaps indicating a more deliberate pronunciation than in most speech situations.)
These results support a hypothesis that the minimum time constant for an active, unidirectional increase in subglottal pressure during the occlusion of a plosive is about 100 msec, with a minimum of 150 msec being more common in normal speech. The figures seem to be fairly stable between (adult) speakers, languages and, at least to some extent, different degrees of total increase.
3.5 The Elementary Physical Dynamic Constraints of the Respiratory Mechanism
In the preceding section, experimental evidence was presented to support the hypothesis that under the condition of little or no transglottal air flow there is a 100 to 150 msec constraint on the rise time of subglottal pressure during an active, undirectional pressure increase. In this and succeeding sections we will consider the extent to which this apparent constraint can be attributed to the elementary physical dynamic properties of the respiratory structures, to the dynamic constraints on the mechanism of muscle contraction, and to higher level neurological constraints. In this section we will consider the constraints imposed by the physical inertances, compliances and resistances of the respiratory mechanism in converting a rapid change in respiratory muscle tension into a variation of subglottal pressure.
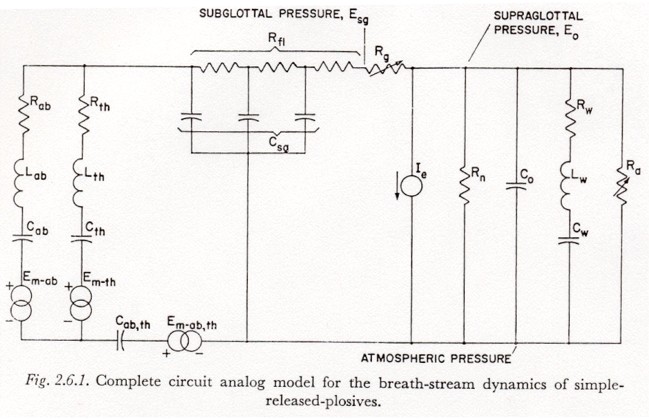
Referring to the model in in Figure 2.6.1, we first note that the assumption that the subglottal pressure variation occurs with no appreciable transglottal air flow permits two simplifications:
(1) All glottal and supraglottal components can be eliminated (including the last section of Rf1).
(2) Since the drain of charge from the capacitors representing the subglottal tissue compliances (Cab, Cth and Cab,th) during the time of subglottal pressure stabilization is relatively small, a change of tension Eab, Eth or Eab,th will be considered equal to the associated change in muscle activation Em-ab, Em-th, or Em-ab,th. The effects of current drain on the simulated tissue compliances will be reintroduced in Section 3.8, and it will be shown more clearly at that point why this assumption is adequate when there is little transglottal air flow.
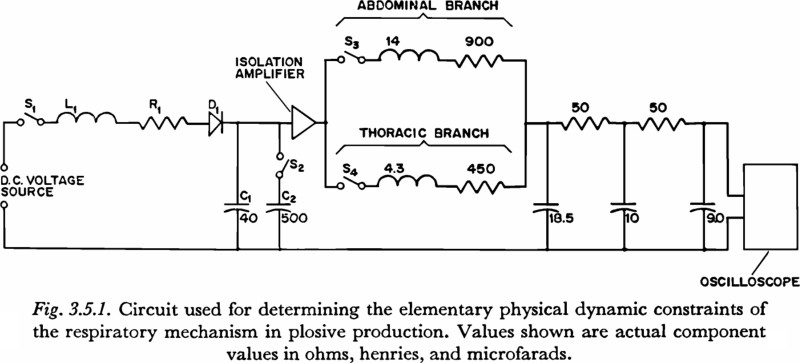
The experimental circuit used to explore the elementary physical dynamic constraints of the respiratory mechanism in plosive production is shown in Figure 3.5.1. On the closing of the switch S1, (with all capacitors initially discharged) an underdamped voltage rise is produced across capacitor C1, or capacitors C1 and C2 in parallel, by the current flow through L1, R1 and D1. The diode D1 acts to clamp the voltage increase at its peak, and prevent the decaying oscillation that would result from underdamped values of the RLC network3.
The voltage increase generated by the circuit of Figure 3.5.1 represents an increase in tension. This voltage is applied, through an isolation amplifier (with a low impedance output and high impedance input), either to the simulated abdominal mass or thoracic mass, or to both in parallel, depending on the settings of switches S3 and S4. The time constant of the voltage rise in the experimental circuit was either 25 msec or 93 msec, depending on the setting of S2. The general rationale for the selection of these two time constants is as follows:
(1) The 25 msec is fast with respect to the observed constraint on subglottal pressure variation. As will be discussed in the next section, it is approximately the time constant of tension increase in an “isometric twitch” in some of the more rapidly contracting skeletal muscle fibers in the body, and so may be considered an upper limit to the time constant of tension increase.
(2) The 93 msec time constant is similar to the time constants observed in the faster of the subglottal pressure variations. It will be seen in the next chapter that a 90 msec time constant also has some significance for the active variation of tension in 'fast' skeletal muscle fibers, though this fact may not be relevant and was not a primary reason for choosing this particular time constant.
The waveforms of the two increases in voltage were selected by trial and error to conform with the variation of tension that might be expected from a consideration of the elementary properties of muscle contraction, as discussed in the next section. The shapes of the curves, aside from the time constants involved, are not of primary significance. It was found, however, that the inputs used permitted the measurement of time constants by the same procedure used for the experimentally obtained subglottal pressure records (Section 3.4, above), since the gradual onset and offset of these inputs produced fewer artifactual discontinuities in the output than would result from a simple ramp function, for example.
It should be noted that records of the voltage increase were taken before an upwards revision was made in the estimation of the inertance in the abdominal branch. A value of 14 henries was used in place of a preferable 17 henries. However, it was decided that the difference in results would not be sufficient to warrant making new curves with the latter value.
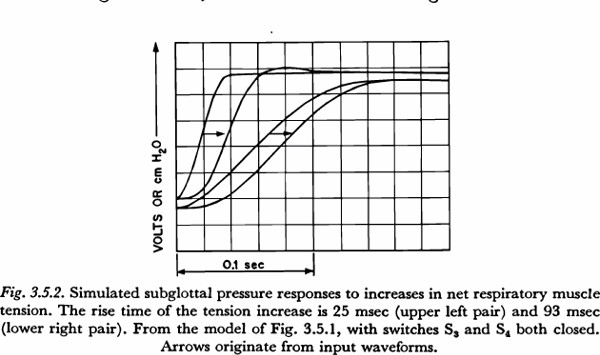
For a given input waveform, the fastest rising output (subglottal pressure) waveform is produced with the thoracic and abdominal branches in parallel. Figure 3.5.2 shows the output that results when the slow and fast waveforms, respectively, for increase in tension are applied to the parallel configuration. The primary fact illustrated in the figure is that, when there is little transglottal air flow and when tension variations are in the range producible by the respiratory muscles, the physical dynamic constraints of the respiratory mechanism will add little if anything to a time constant of subglottal pressure increase. Looked at from another point of view, it may be said that the physical dynamic properties of the respiratory mechanism could be responsible for no more than about 20 msec of the 100 to 150 msec time constant constraint observed.
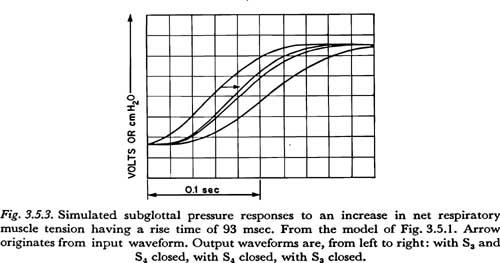
We may conclude that the faster tension variations in the respiratory musculature would be very similar to the slower of the two input waveforms generated, i.e., the waveform having the 93 msec rise time. (If faster increases in tension were possible, one would expect that faster variations in subglottal pressure would have been observed.) It is of some interest to see how the action of such a maximally fast tension increase differs when applied, respectively, to the thoracic and abdominal masses. Figure 3.5.3 shows the results of applying the 93 msec input with only one of the two switches S3 and S4 closed at a time, and also for comparison, with both switches closed as before. The resulting time constants of subglottal pressure rise are 115 msec for the abdominal branch alone, 95 msec for the thoracic branch alone, and 90 msec for the input applied to both thorax and abdomen. It may be concluded then that the additional inertance and tissue resistance associated with movements of the diaphragm adds about 20 msec to the minimal time constant of subglottal pressure increase attainable in movements of the thorax. (Since the 14 henry inductance used in the abdominal branch is somewhat low, as noted above, the total addition in time constant is probably somewhat greater, say about 25 msec.) This difference in response time, though small, may be at least partially responsible for the use of portions of the internal intercostal musculature in the production of the faster increases in subglottal pressure in speech, as has been reported for adult subjects by some investigators. The internal intercostal muscles used are thought to act primarily to lower the thorax. (STETSON, 1951; LADEFOGED, 1960; see also the comments in Sections 3.6 and 3.8 below.)
It may also be noted that for the values of tissue resistance used in the model, the response to tension variations would be underdamped; little or no overshoot would be expected in the increase in subglottal pressure unless the increase in tension had an overshoot. It is therefore doubtful that an observed overshoot in a subglottal pressure increase, such as is present in Figure 3.4.1, can be attributed to kinetic energy in the physical masses of the respiratory mechanism. This is especially true for slower increases; for example the increase in Figure 3.4.1 has a time constant of 190 msec, over twice the 93 msec of the increase in Figure 3.5.3. A possible explanation for the observed overshoot in the subglottal pressure increase will be discussed in Section 3.7. It should be kept in mind that these results, as all others in this section, are highly dependent on some rather speculative estimates of tissue parameters, and should be reexamined when better estimates become available.
3.6 Some Dynamic Constraints in Respiratory Muscle Contraction
In the preceding section it was shown that very little of the 100 to 150 msec constraint on the time constant for the active increase of subglottal pressure can be attributed to the physical dynamic properties of the respiratory structures. In this and succeeding sections we will consider the extent to which the constraint can be attributed to the dynamic properties of muscle contraction and to higher level neurological mechanisms, in that order.
As defined previously, active control of subglottal pressure is accomplished by changing the innervation of some part of the muscles of respiration. An increase in pressure can be brought about either by contracting (increasing the tension of) expiratory muscles, or by relaxing inspiratory muscles. A number of researchers have investigated and interpreted STETSON’s earlier hypothesis that the faster increases in subglottal pressure are produced primarily by tensing certain expiratory muscles, with the fastest increases produced by the internal intercostals (STETSON, 1951; DRAPER et al., 1959; LADEFOGED, 1960, 1962; HOSHIKO, 1960; EBLEN, 1963; see also the comment in Section 3.5). Though the hypothesis has not yet been proven, it appears that we can at least say that an onset of, or increase in, activity in certain segments of the internal intercostal and abdominal musculature can often be detected electromyographically, and this activity is well correlated with strong, fast increases in subglottal pressure. The general question considered in this present section is: what is the rise time of the increase in muscle tension resulting from a 'step' increase in the level of innervation of the expiratory muscle groups?
This question is really not well defined, primarily because we do not know what might be considered a 'step' increase in the innervation of a muscle, i.e., a change in the time-space distribution of motoneuron activity that could be considered a single, fast, voluntary change in the level of muscle innervation. However, results from many experiments with artificial sequences of stimuli do provide some information about what the tension buildup might be if we did know the true time-space pattern of motoneuron excitation.
If an active buildup in subglottal pressure is accomplished primarily during a period of high resistance to air flow, as is the case in a prerelease pressure increase for a plosive, the change in muscle tension will be accompanied by very little shortening, since the structures to which the muscles are attached will move relatively little. The isometric (no change in length) tension development in mammalian striated skeletal muscle has been studied considerably by artificially stimulating single muscle fibers, single motor units, or entire muscles, with single or repetitive stimuli. (The experiments of COOPER and ECCLES, 1930, ROSENBLUETH and RUBIO, 1960, and BULLER and LEWIS, 1965 are illustrative. A brief summary can be found in RUCH and FULTON, 1961.) The stimuli have been applied either to the motor nerve or directly to the body of the muscle. Applying the stimulus to the motor nerve results in a small temporal disperson in the excitation of the various fibers, but for most studies the effect of this dispersion on changes in tension is negligible (ROSENBLUETH and RUBIO, 1959, p. 706).
The unit of tension production in mammalian skeletal muscle is the twitch of a single fiber, or, more exactly, the twitch of all the fibers activated by a single axon of the motor nerve (the totality of these fibers comprise a 'motor unit'). A twitch is the brief contraction (shortening and/or tension increase) that results when an above-threshold stimulus is applied to the fiber, if there has been no recent previous contraction. The tension buildup in an isometric twitch in mammalian skeletal muscle has a time constant of about 5 to 50 msec, depending on the type of muscle fiber (RUCH and FULTON, 1961, p. 104). The 'time constant', when not otherwise noted, is determined by the maximum slope and overall tension change, as defined above. Figures quoted in the physiological literature generally refer to 'contraction time', which is defined as the time from the application of the stimulus to the point of maximum contraction. This time could be as much as two or three times as long as the time constant referred to above.
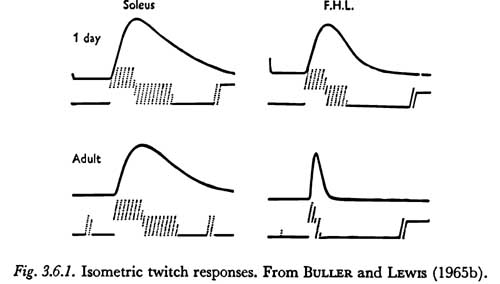
Figure 3.6.1 shows the 'twitch' responses of two hind limb muscles in the cat, the soleus and flexor hallucis longus, which are composed primarily of slow and fast fibers, respectively. The responses are of the whole muscle after a maximal stimulus to the motor nerve. However, due to the uniformity of fiber content, they have the general form of the twitch responses of a single fiber. The 'contraction times' shown in the figure for the adult muscles are 74 and 17 msec for the soleus and flexor hallucis longus, respectively.
The differences in Figure 3.6.1 between the response of the muscles of the adult cat and those of the kitten illustrate the general observation of BULLER and LEWIS that these muscles are about equally slow at birth and differentiate during the first thirty or forty days. The eventual speed of the muscle seems to be a property not so much of the muscle itself but of the type of motoneuron connected to it. The significance of this process of muscle differentiation to the acquisition of speech motor patterns, if any, will not be clear until the phenomenon is better understood.
Though knowledge of the distribution of slow versus fast fibers in the various muscles of respiration would have obvious implications regarding the use of these muscles in producing rapid pressure changes, their distribution does not appear to have been charted. Because of this lack of basic information, any discussion of the role of fiber speed in the production of subglottal pressure variations must be highly speculative.
In those studies that have been made of fiber speed distribution in the body, the slow fibers seem to be distributed mainly in the muscles which must hold their tension for a long period of time but are not used for fast movements (such as the postural muscles). Conversely, the fast fibers seem to be distributed mainly in muscles which are naturally employed in brief, fast movements, such as in many of the flexors of the limbs (RUCH and FULTON, 1961, p. 104). For example, a study of the muscles of the larynx has shown that the thyroarytenoid and lateral cricoarytenoid muscles are among the fastest muscles of the body (though measurements were made only on dogs and cats, it is likely that the results can be extended to other mammals), with twitch time constants of under 10 msec (MARTENSSON and SKOGLUND, 1964). The authors assume that the fast contraction rates are associated with the functioning of these particular laryngeal muscles in the protective, reflex closure of the glottis. In comparison, a glottal abductor muscle, the posterior cricoarytenoid, was found to have a time constant of about 20 msec, which is more typical of the time constants found for the faster of the extremity muscles.
Analogous heuristic considerations might be used to predict the fast and slow fiber composition of the various muscles involved in respiration, but no such speculation will be made in this study.
Though the twitch time constant of the faster fibers in a muscle represents an upper limit to the contraction time constant of the muscle4, and may possibly be approached in some reflex type of contractions, it is not at all clear that this time constant can even be closely approached in the centrally-mediated, voluntary movement patterns involved in speech. Though the evidence is scarce in this area, it seems that in fast voluntary movements the firing rate of a large proportion of motoneurons is high enough so that the twitches produced will tend to overlap or summate. (For example, see RUCH and FULTON, 1961, p. 110. Also, ERNST, 1963, p. 273, states that “...actual movements are, in general, not single twitches but short tetani.”)
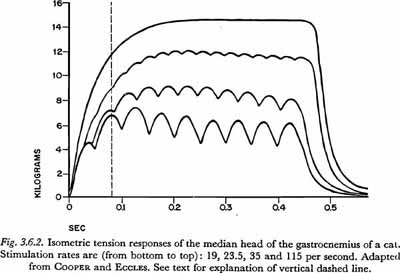
The processes of summation and tetanus are illustrated in Figure 3.6.2, which is taken from one of the earlier articles in which these phenomena were recorded without significant distortion due to instrumentation problems. The figure illustrates tension buildup or summation in a 'fast' muscle, the gastrocnemius of a cat, when the rate of stimulation (of the entire muscle) is increased beyond the point where the twitches decay between stimuli. The properties of the muscles used in the experiment appear to be similar to the properties of some of the moderately fast human skeletal muscles. The time constant for a twitch is about 25 msec, and the 'contraction time' is about 40 – 50 msec (compared to about 8 and 17 msec, respectively, for the quite fast flexor hallucis longus represented in Figure 3.6.1). The tension in the gastrocnemius approaches tetanus (maximum possible, under the given conditions of load) for stimulation rates above about 50 shocks/sec. The rate necessary to approach tetanus is almost completely dependent on the contraction time of the twitch. We may also note that the tension in tetanus is approximately three times the maximum tension reached in a twitch, a ratio a little less than the average of four times mentioned by RUCH and FULTON (1961, p.105).
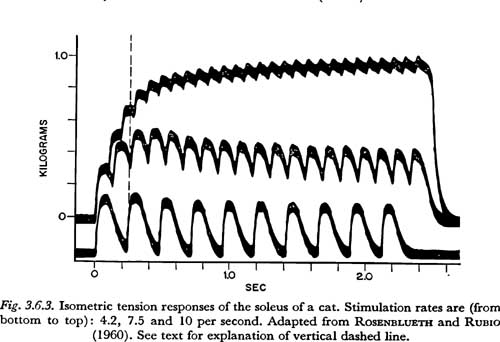
A series of isometric tension curves showing the approach to tetanus in a slow muscle is shown in Figure 3.6.3. The muscle used was the soleus of a cat. The records were taken from a study of tetanic contraction by ROSENBLUETH and RUBIO (1960). Other records in their article show more clearly that the twitch 'contraction time' for this muscle is about 125 msec. At 10 impulses/sec, which is the highest rate of stimulation shown in Figure 3.6.3, the muscle appears to reach about 2/3 to 3/4 of its maximum or tetanic tension. For this muscle, maximum tension would be approached with stimulation rates over about 20 impulses/sec. (This is shown more clearly in COOPER and ECCLES,1930. Figure 8 in that work shows the tension increase for a very similar muscle at 23.5 impulses/sec.)
If it is true that in a fast, voluntary increase in tension, a majority of the motor units involved pass from an unsummated or slightly summated tension to a highly summated tension, then the inherent time constant of the muscle is highly dependent on the time constant of tension increase in summation. Examination of the records in Figures 3.6.2 and 3.6.3 indicates that it is not altogether unreasonable to specify an “average” time constant that reflects the general ability of the muscles represented to increase tension in summated isometric contraction.
In Figure 3.6.2 we can see that at 80 msec after the onset of the tension increase (the time indicated by the vertical dashed line), the average tension for each rate of stimulation has reached between 2/3 and 9/10 of its maximum. [It is accurate to consider the average tension because in actual movements the net muscle tension is the sum of contributions by many nonsynchronously firing motor units (RUCH and FULTON, 1961, p. 110).] In addition to this delay in tension increase, in natural movements there is a delay caused by the nonsynchronous onset of activity, due to the length and diameter of the muscle fibers and motoneurons. (As noted above, a small amount of such temporal dispersion results in a slow initial tension increase, or a 'foot', on the curve of the tension buildup.) The velocity of the action potential in mammalian striated muscle is about 5 m/sec (RUCH and FULTON, 1961, p. 117), and the velocity of the motor nerve impulse is about 10 – 40 m/sec (BOURNE, 1960, p. 397). In view of the differences in the lengths of the motor nerves which innervate the various muscles of respiration, and the differences in the lengths of fibers in these muscles, it seems that an additional factor of at least 10 msec should be added to the minimum time constant of respiratory muscle tension increase (10 msec is equivalent to 5 cm of muscle fiber length or to about 25 cm of nerve fiber length). We will therefore consider the minimum time constant of tension increase in response to a step increase in muscle innervation for fast muscle fibers in the respiratory system to be 90 msec (80 + 10).
From Figure 3.6.3 we can similarly estimate a minimum time constant of tension increase for slow fibers to be about 250 msec. In the figure, a vertical dashed line is shown at 250 msec from the onset of contraction. Propagation velocities are low compared to 250 msec and can be neglected.
3.7 The Coordination of Respiratory Innervation and the 'Ballistic' Movement
In the last section, evidence was presented that the time constant of respiratory muscle tension increase, in response to a step increase in innervation, can be between 90 and 250 msec, depending on certain yet unknown properties of the respiratory muscles and the space-time pattern of motor unit activity in this type of action. As shown in Section 3.4, an increase in muscle tension with a time constant in this range will produce a subglottal pressure increase having a slightly higher time constant, due to the physical dynamic properties of the system. However, these observations, even if made more exact, are not sufficient to explicate the constraints on the active variations of subglottal pressure during the occlusion of a plosive. It is well known that fast, learned movements can involve the coordinated activation of opposing muscle groups to increase the speed of the resulting movement. To understand the true constraint on active changes of subglottal pressure, we must know the extent to which such changes in pressure can be produced by a coordinated combination of a strong net positive change in muscle innervation, followed by a net negative change. (It is beyond the scope of this work to consider more complex temporal innervation patterns than a coordinated positive and negative change.)
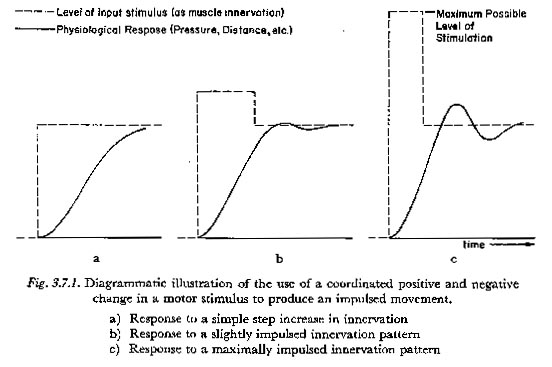
In this work we will use the term impulsed to indicate any pattern of motor innervation during a unidirectional pressure increase in which an initial overstimulation (of any significant amount) is compensated by a drop in innervation level before the quasi-steady-state target response is reached. The use of the term 'impulsed' is illustrated in Figure 3.7.1. The solid lines indicate diagrammatically the response to the pattern of motor innervation shown. The scales for the innervation and response are normalized so that a constant innervation at a level represented by a given ordinate will produce an asymptotic response at the same ordinate.
The diagrams of Figure 3.7.1 are meant to illustrate the principles that:
(1) A more impulsed innervation pattern can produce a faster response than a less impulsed pattern;
(2) impulsed innervation patterns in general require a greater expenditure of energy;
(3) the more impulsed the innervation pattern becomes, the less controllable is the response. In general an impulsed response will tend to be more oscillatory. In addition, with a highly impulsed innervation pattern a small change in the relative timing of the increase and decrease will tend to have a large effect on the level of the response.
It is likely that most of the unidirectional subglottal pressure changes in speech are produced by innervation patterns that are to some degree impulsed. We have already observed that the presence of an overshoot in the subglottal pressure response in Figure 3.4.1 could not have been due to a strictly physical mechanism. It is likely that such an overshoot was due to the use of a somewhat impulsed innervation pattern. (This same phenomenon was observed with another speaker when, in a similar hesitation before the release of a plosive, the subglottal pressure was held briefly.) It is clear that the respiratory mechanism is capable of producing pressure changes with a highly impulsed mechanism; most pressure increases in normal speech are less than 15 cm H20 in magnitude, whereas the average maximum adult expiratory capacity is much larger (about 90 cm H20; National Academy of Sciences, 1958).
A compensatory negative step of innervation could be achieved either by an increase in the activation of inspiratory muscles or by a decrease in the activation of expiratory muscles. All other things being equal, it seems likely that a decrease in net innervation would be accomplished by a decrease in the activation of expiratory muscles. For example, the same expiratory muscles which were innervated for the positive step could be relaxed for the negative step. This may be compared with STETSON's hypothesis that the positive, expiratory impulse has to be 'checked' by activation of inspiratory muscle groups (STETSON, 1951)5. LADEFOGED has reported that he did not find such inspiratory activity (for example, LADEFOGED, 1960). The activation of inspiratory muscles would be necessary if there was an appreciable inertial component in the system to be counteracted. In Section 3.5 evidence was presented that the physical dynamic constraints, including physical inertia, were small, especially in movements of the thorax. (Though it will be shown in Section 3.8 that some reservations on this claim may be necessary.) There may be higher level neurological constraints whose effects are similar to physical inertia, but information relative to this area is scarce.
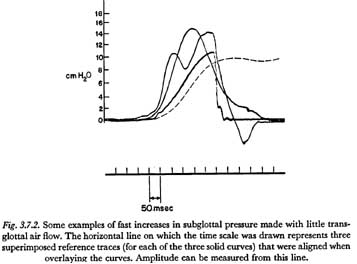
As mentioned above, if highly impulsed motor innervation patterns are used to produce short time constants, there will be a coordinate reduction in the ability of the central nervous system to regulate the shape of the subglottal pressure waveform. An outgrowth of this insufficiency is the tendency for a fast unidirectional rise in subglottal pressure to appear underdamped or oscillatory in its termination. This characteristic is illustrated in Figure 3.7.2. The three solid curves superimposed in this figure were of subglottal pressure, measured supraglottally, and taken from the sequence of records made by the experimenter, as described in Section 3.4 above. The two slower-rising curves were made with a bilabial and velopharyngeal closure throughout, and therefore show subglottal pressure at all times. The slowest rising solid curve was made during the production of the isolated English word 'pot', and therefore indicates subglottal pressure only until the time of the release. The dashed curve is for the increase in pressure shown in Figure 3.4.1.
It is hoped that the curves in this figure illustrate the tendency of fast rises of subglottal pressure to be oscillatory in nature. Of special interest is the fastest curve, which has an initial rise with a time constant of only 53 msec. It might be speculated that the initial increase of pressure was produced by a large increase in net innervation followed after only about 20 msec by an almost equally large decrease. If so, the increase of pressure shown might be considered with some validity to be the response to a maximally impulsed innervation of the respiratory system, under the condition of no transglottal air flow. (It should be noted that the experimenter was attempting to produce only a single unidirectional rise in pressure.)
In Section 3.1 the distinction was made between a 'unidirectional' and a 'cyclic' change or movement. So far in this chapter we have considered only a unidirectional (increasing) change in subglottal pressure, i.e., a change which is approximately maintained for some appreciable time after it is attained. However, there are many speech situations in which an increase in pressure is followed so quickly by a relatively large decrease, that the motor command for the decrease must be initiated considerably before the full increase is attained. In such a case, the motor commands for the increase and decrease are highly dependent and might be better thought of as one pattern of motor innervation. The resulting changes of pressure might also be considered as one cyclic variation.
Apparent cyclic variations in subglottal pressure have been illustrated in two figures presented previously in this chapter. In Figure 3.4.2, the increase of pressure during the occlusion of the final plosive is closely followed by a decrease of pressure to a negative value sufficient for inspiration. It is likely that the increase and decrease could be better understood as one coordinated cyclic movement.
In Figure 3.7.2, the second-fastest rising pressure increase is clearly part of a coordinated cyclic pattern. The time constant of the initial increase, about 120 msec, is rather typical of the time constants measured in fast, cyclic, active subglottal pressure increases. In this regard, various pressure recordings showed a tendency for the faster cyclic pressure variations to have a pressure increase time constant which is about 20 or 30 msec faster than the time constant for the faster unidirectional pressure increases. However, there were a number of exceptions to the rule, and no meaningful statistics could be extracted from the limited data taken.
It is of some interest to relate the results of this chapter to the distinction between 'controlled' and 'ballistic' movements that has sometimes been made in the field of physiological phonetics (STETSON, 1951). The comments here will refer only to respiratory movements in the production of active changes in subglottal pressure with little or no transglottal air flow.
If the conclusions of Section 3.5 are valid concerning the small inertial component in the respiratory movements of speech, then the term 'ballistic' could not be used to describe respiratory movements, in the normal physical sense of the term as 'the response of a system to an impulse stimulus'. However, it would still be possible to retain some elements of that meaning if one considers the impulse to be a unit of activation at some higher neurological level and the inertia to be supplied by the (non-physical) physiological and neurological constraints of the more peripheral motor system. For example, there seem to be certain inertia-like properties in the basic mechanism of muscle contraction, even though these properties are undoubtedly not strictly analogous to pure physical inertia.
Regardless of the validity of the common physical interpretation of the word'“ballistic', the controlled versus ballistic distinction might still be useful if interpreted as merely indicating 'slow' versus 'maximally fast'. But problems remain with this interpretation also. In a general sense, it may be said that there is a continuum between very slow respiratory movements, which result in pressure time constants longer than about 250 msec, and very fast respiratory movements, which result in time constants of less than, say, 100 msec. There is a range of 'fast' response patterns in which additional speed can be realized at the cost of more effort and less controllability. However, under given speech conditions (rate of speech, loudness, effort, etc.) it may be possible to define a slow-fast or controlled-ballistic distinction in a more binary manner.
3.8 The Transfer of Respiratory Muscle Tension
It is apparent that an increase in the tension of any given respiratory muscle during speech can occur not only by active innervation but also by passive stretching due to the contraction of other muscles. However, it is difficult to find any reference to the dynamic characteristics of the transfer of energy between groups of respiratory muscles. In this section, the model of Figure 2.6.1 will be used in an initial exploration of this phenomenon.
We have already mentioned the hypothesis that many of the faster active increases in subglottal pressure are produced primarily by depressing the rib cage through the innervation of the internal intercostal musculature (Sections 3.5 and 3.6). In this section we will assume that this hypothesis, or some hypothesis similar to it, holds, and we will investigate the variations of muscle tension and subglottal pressure that might result from a 'step' increase in the innervation of the internal intercostal muscles (or any other muscles which act only to depress the rib cage).
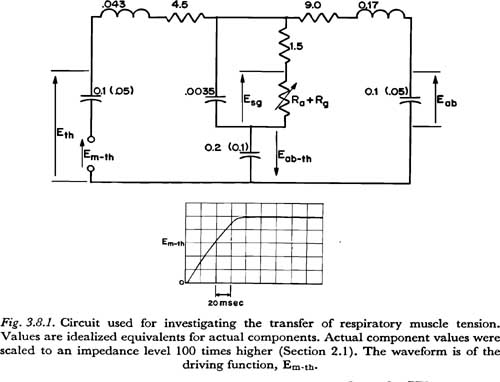
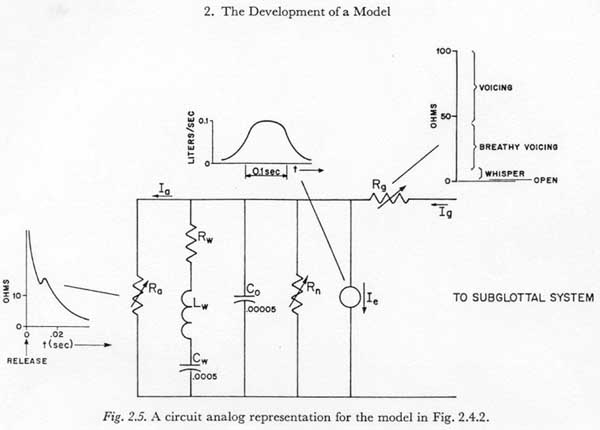
Figure 3.8.1 illustrates the experimental procedure used. The circuit diagram in this figure is essentially that of Figure 2.5, except for the following modifications: (1) The glottal-supraglottal parameters are simplified to a single resistance (Ra + Rg), which could be varied to simulate different transglottal air flow rates. (2) The network for Rf1 and Csg is simplified to one resistor and one capacitor. For the time constraints of interest (5 or 10 msec), this representation is essentially equivalent, and makes the principles involved somewhat easier to visualize. (3) All muscle activation sources except Em-th are removed. (4) The components are rearranged for clarity. (5) Two distributions of tissue compliance are noted. The larger (unparenthesized) values have been taken from the respiration literature, as noted previously, and are probably suitable for a fairly relaxed state of the respiratory muscles. The smaller (parenthesized) values were rather arbitrarily chosen as half the values for the relaxed mechanism, to give some idea of what perturbations in results occur when some of the respiratory muscles are tensed and the corresponding tissue compliances are reduced.
To simulate the muscle activation Em-th, it was desirable to have a voltage source (of low internal impedance) which generated a voltage rise with a time constant that could be considered a lower limit for the respiratory muscles involved. It was discovered that switching on an available low-voltage power supply produced a repeatable voltage rise as shown in Figure 3.8.1 with a time constant of about 70 msec. This waveform was invariant with the loads applied in the experiments described below, indicating that the desired low internal impedance characteristic was present during the period of increase. The function, though not of optimal shape, and slightly too fast rising, was considered adequate for the initial investigation described here6.
The waveform in Figure 3.8.1, as others described below in this section, were recorded on a Tektronix model 564 storage oscilloscope, and photographed with a Dumont-Polaroid oscilloscope camera. The responses to Em-th were recorded simultaneously on the storage oscilloscope. The recorded variables were:
(1) Eth — effective force applied to the thoracic mass only
(2) Eab — effective force applied to the abdominal mass only
(3) Eab,th — effective force acting simultaneously on the thoracic and abdominal masses
(4) (Esg - Eab,th) — subglottal pressure minus Eab,th
The last variable was recorded in lieu of Esg, which was not obtainable simultaneously with the others on the same oscilloscope (a differential amplifier would have been necessary). Esg was obtained by manually adding the ordinates of traces 3 and 4.
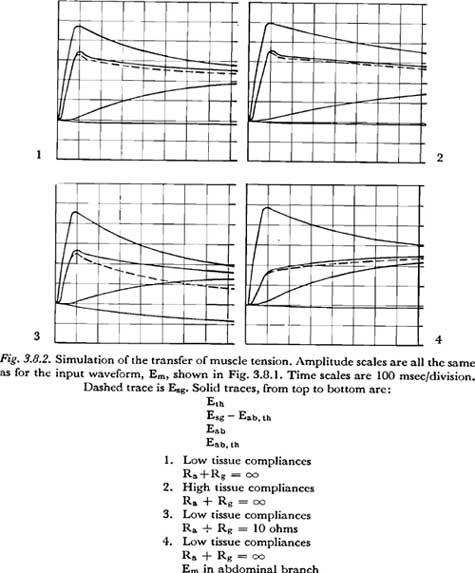
Some of the results are presented in Figure 3.8.2. The derived curves for Esg are shown as dashed lines. Photographs 1 and 2 show the equalization of tension with no transglottal air flow [(Ra + Rg) = �], assuming, respectively, lower and higher values for tissue compliance.
Photograph 3 shows the pattern of tension equalization if the total glottal-supraglottal air flow resistance is 10 ohms. This value might be considered roughly typical for the glottal-supraglottal resistance during the aspiration of an unvoiced aspirated plosive. (For example, compare the volume velocities for unvoiced plosives recorded by ISSHIKI and RINGEL with the pressures shown in their sample records.)
The fourth photograph shows, for comparison, the tension equalization pattern that results when the voltage source is put in the abdominal branch, instead of the thoracic. The lower values of tissue compliance were used, with the condition of no transglottal air flow simulated.
It is difficult, if not impossible, to draw concrete conclusions from these results, since almost all the pertinent parameters of the simulation were based on speculative estimates (i.e., the tissue resistances, tissue compliances, effective masses and the source functions.) However, there are a few observations possible which might be valuable in indicating where further research is necessary:
(1) The (RC) time constant for the equalization of the abdominal and thoracic
tensions, given a thoracic tension change, is essentially equal to
[Rth + Rab][Cab �
Cth/(Cab + Cth)]
For the values assumed, this time constant is about 0.34 sec for the smaller compliances and 0.68 sec for the larger compliances. Time constants in this range are not so fast, nor so slow, that they can be neglected a priori in the study of the action of the respiratory mechanism in speech.
(2) It is interesting to note that the chest movement induced by the internal intercostal muscles will cause a reduction in Eab,th, which includes, for example, the tension of those abdominal muscles that also act on the lower part of the thorax. This result stems from an assumption of a rigid bony thorax that compresses mainly by tilting downward. The assumption may be somewhat strong, especially for the more flexible bony structure of a child. (One may question whether the internal intercostals, acting alone, are very effective in producing pressure increases in a child because of the flexibility of the bony thorax.)
If (Ra + Rg) = �, the change
in Eab,th is small, but for the low air flow resistance in the aspirated
interval of a plosive, this change is not negligible. Since the time constant
of charge for Cab,th is much longer than the normal interval for
plosive aspiration, the rate change of Eab,th would remain
approximately proportional to Em-th during the interval. This rate
can be computed approximately by considering the large tissue compliances as
short-circuited, considering the small Csg as absent (open circuited),
and solving the remaining 2-mesh resistive network for the charging current
of Cab,th. The rate of change of Eab,th is
then equal to
[Icharging] / [Cab,th]
and is approximately:
[Em/Cab,th] x [Rp/(Rfl
+ Ra + Rg) (Rth + Rp)]
where Rp is the
resistance of Rab in parallel with (Rf1
+ Ra + Rg) and is given by:
[Rab (Rf1 + Ra + Rg)]
/ [Rab + Rf1 + Ra + Rg]
For the values assumed in the simulation for Photograph 3 of Figure 3.8.2, the computed rate of increase of Eab,th is approximately equal to Em-th/1.5 cm H20/sec. Since any buildup of Eab,th results in a proportional reduction in subglottal pressure Esg (diagram of Figure 3.8.1), this factor also cannot be ignored a priori in the study of the action of the respiratory mechanism during an aspirated plosive (or during the production of any other sounds having a period of high air flow).
(3) Even though from the discussion of Section 3.5 we might expect the rise of subglottal pressure to be overdamped and have no overshoot, there is an appreciable overshoot visible in all photographs in Figure 3.8.2 in which the simulated tension increase acted on the simulated thoracic mass. Though some part of the overshoot is probably attributable to the shape of the source function Em-th employed (Em-th reaches its maximum value quite abruptly), it appears that a participating factor is the 'inertia' of Mab. Mab delays the drain of charge through Rab (as seen from the delay in the increase of Eab) and allows Esg to build up during the delay. In physiological terms, depressing the rib cage raises the thoracic pressure and thereby forces down the abdominal mass, but the pressures within the thoracic cavity will tend to be slightly higher before the abdominal mass is set in motion. The significance of this observation lies in the conclusion that, even if the faster active respiratory movements are produced only by variations in Em-th (raising or depressing the rib cage), the dynamic characteristics of the subglottal pressure response cannot, a priori, be considered entirely independent of the dynamic characteristics of the abdominal (diaphragmatic) system.
3.9 Some Conclusions
From measurements of active subglottal pressure variations with little or no transglottal air flow, it appears that a lower limit for the time constant of a controllable pressure rise of about 5 to 10 cm H20 is about 100 msec. This limit is approachable with increases that are cyclic in nature, i.e., that are closely followed (or preceded) by a decrease of about the same magnitude. For controllable unidirectional increases (from one quasi-steady-state pressure to another quasi-steady-state pressure) the lower limit for the time constant appears to be slightly higher, or about 120 msec (Section 3.4).
It seems that only about 20 msec of the time constant associated with the active variation of subglottal pressure could be attributable to the physical properties of the respiratory system. The remaining part of the time constant must be attributable to the dynamic constraints inherent in the mechanism of muscle contraction and to the dynamic constraints in the central nervous system (Section 3.5).
From observations of the shape of the pressure response curves, an estimate was extrapolated for the underlying dynamic constraint on the buildup of respiratory muscle tension. It was judged that this constraint would result in a time constant in the subglottal pressure increase of over 200 msec in response to a simple step increase in the neural excitation. At that level in the nervous system at which the constraint is imposed, briefer (unidirectional) increase time constants are apparently obtained by an initial overstimulation, or what is called here an “impulsed mechanism”. If the relevant muscles of respiration were among the more slowly contracting skeletal muscles, a time constant of over 200 msec could be attributed directly to the mechanism of muscle contraction. If the muscles were of the faster contracting type, however, with a basic time constant of 90 to 100 msec, then a time constant of 200 msec would have to result, at least in part, from higher level neurological constraining mechanisms (Sections 3.6 and 3.7).
The neural mechanisms which are used to produce speech with fast coordinated respiratory movements must be considered largely unknown. From the small amount of data considered in this study, however, the hypothesis might be advanced that impulsed respiratory movements produced with maximal contractions of the relevant respiratory muscles are in general not sufficiently controllable to be useful at normal rates of speech and at moderate loudness levels. It may be necessary to define a maximallv-fast respiratory movement in speech (or, what might possibly be considered a “ballistic” movement) in terms of the specific requirements of the particular conditions of speech production (rate, loudness, etc.) (Section 3.7).
In this chapter we have not considered explicitly the latency of the subglottal pressure response to a stimulus in the central nervous system. Latency of response is not of primary importance in thoroughly learned motor patterns such as are involved in adult speech. Latency may be of some interest, however, in that a long latencv can be an ultimate restriction on the ability of the mechanism to regulate the controlling physiological variables by using information from the sense organs.
Last Chapter |
Next Chapter |