
Publications of Dr. Martin Rothenberg:
The Breath-Stream Dynamics of Simple-Released-Plosive
Production
2.1 Mechano-Acoustic Models and Circuit Analogs
In this chapter the physical properties of the speech mechanism will be considered, with the purpose of identifying those actions which are pertinent to the study of the breath-stream dynamics of simple-released-plosive production. The actions identified must be adequate for specifying the properties of a model of simple-released-plosives. For conceptual simplicity and mathematical tractability it is desirable that such a model be in the form of a network of linear, time invariant, lumped-parameter elements, and idealized, independent sources (driving functions). Wherever possible, the above constraints will be imposed. It is common practice to represent such a model in terms of the conventional symbols of electrical circuit theory (idealized resistances, inductances, capacitances, and current and voltage sources). Such representations will be used freely in this work, and referred to as 'circuit analog' representations to differentiate them from the networks of idealized mechanical and acoustical elements.
The terms 'electrical circuit analog' and 'electrical analog', when used, will refer to an actual simulation with real components1.
Since the speech mechanism has interacting physiological, physical, and acoustic parameters, the terms in which the parameters of the model are to be expressed must be determined. The parameters can be expressed in their respective units, such as neural firing rate, force (due to muscle tension), and air pressure, by using appropriate transformations at each interface between two systems. This approach is conceptually inconvenient, however, if one of the systems has a special significance in empirical observations. Since air pressure and volume velocity are the parameters of ultimate significance and are the most commonly measured parameters in the study of breath-stream dynamics, all units will be expressed in acoustic terms and scaled so that the physiological-physical and the physical-acoustic transformations are both unity. With this procedure no transformations ('transformers' in the circuit representation) are necessary.
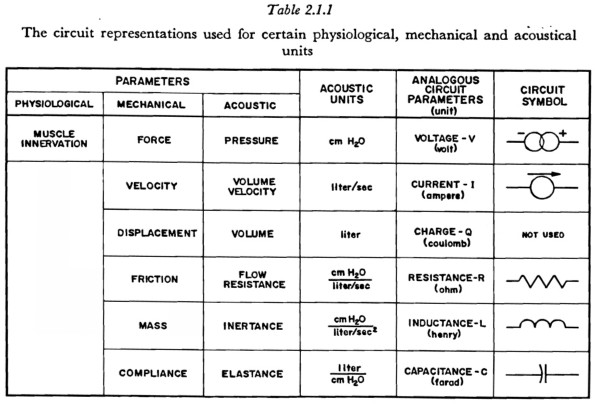
The relationships between the physiological, mechanical (physical), and acoustic parameters, and their representations in the model, are indicated in Table 2.1.1.The table indicates, for example, that an applied force, such as an increase in muscle tension, will be represented by a “voltage source” in the network and will have the units of cm H20. For brevity, the name for an electrical unit (such as the Ohm) will occasionally be used for its acoustic counterpart (cm H20 /1/Sec)2.
In the present study, when some part of the mechanism of speech production was simulated with electronic components, all impedances were increased by a factor of 100 to bring the numerical values of resistance, inductance and capacitance (in Ohms, Henries and Farads) into the same ranges as are commonly available for electronic circuit elements. However, the results of a simulation study are always presented in the cm H20, 1/sec units shown in Table 2.1.1.
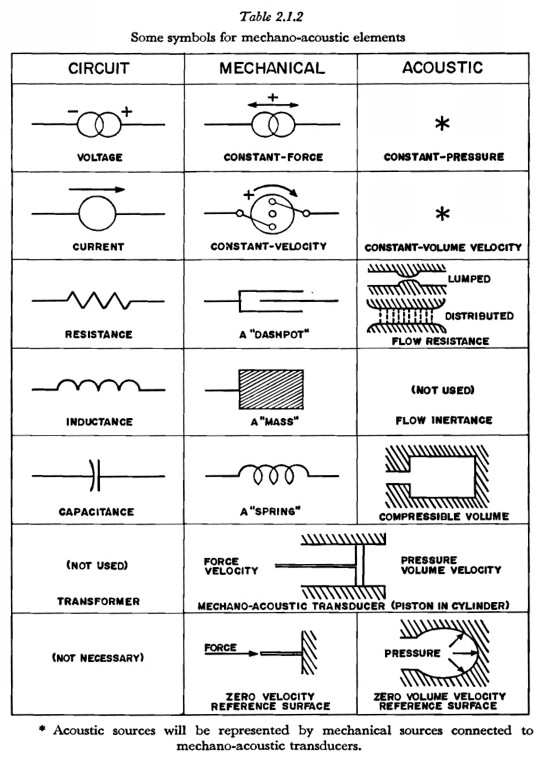
As an intermediate step in the development of circuit-type models for particular mechanisms of speech production, a number of diagrams will be presented which contain idealized mechanical and acoustical elements. Table 2.1.2 presents those elements that will be used and describes their function.
Listed at the left in Table 2.1.2 are the analogous elements in the circuit-type representation. Transforming from a mechano-acoustic representation to a circuit type involves replacing mechano-acoustic elements with their circuit equivalents and forming a network in which the relationships among the variables (forces, velocities, pressures, and volume velocities) are invariant when transformed into the current and voltage variables of the circuit analog.
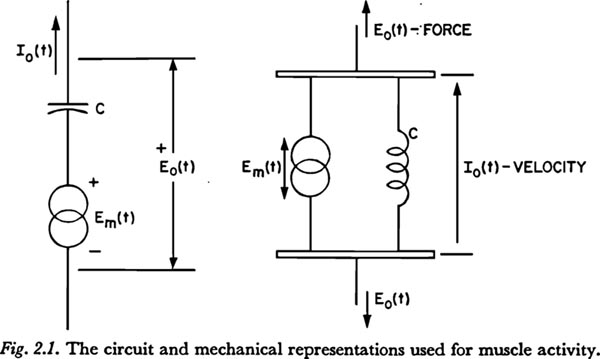
One entry in Table 2.1.1 requires further clarification. It would be highly desirable to be able to represent the relation between a neural innervation function and the resulting variations in muscle tension and length, even though, as will be discussed further in Chapter 3, the general relationships involved are not known and only certain limited empirical relationships have been determined. The circuit-type representation to be used in this work for the activation of a muscle consists of a source of voltage [force] Em(t), in series with [across] that compliance whose voltage [tension] would be altered by the contraction of the muscle. The mechanical and circuit analog representations are shown in Figure 2.1. If the voltage [tension] and current [velocity] of the output are Eo and Io, respectively, the following relation holds:
This equation can be interpreted as stating that an increase in muscle innervation, as represented by an increase in Em(t), can result in an increase in tension Eo(t), or a shortening 1/C òIo(t)dt (the mechanical dimension of òIo(t)dt is distance), or some of both, depending on the freedom of the muscle to shorten, i.e., the external impedance between the output nodes.
As will be seen in Chapter 3, the above representation is adequate for certain cases of interest if we do not take Em(t) to be the innervation function itself, but rather to be a transformation of the innervation function that depends on the contraction properties of the muscle fibers. (Certain examples of the transformation of a “step” increase in innervation are shown in Figs. 3.6.2 and 3.6.3.) The transformed innervation function Em(t) will be referred to as the muscle 'activation' function. In the cases of isometric (no change in length) or isotonic (no change in tension) contraction, Em(t) would be proportional to the change in tension or length, respectively.
However, changing the activation pattern of the muscles of respiration will in general alter both the tension and the resiliency of the movable surfaces of the thoracic cavity. Since the symbols representing compliance normally indicate ideal linear elements, changes in activation should be represented not only by the force functions, but also by changes in the magnitude of the appropriate compliances. (If the compliance symbol could be taken to represent a nonlinear element, such as a real mechanical spring, then changes in muscle activation could be more directly related to the movements at the arrows in the mechanical diagram in Figure 2.1.) In this work the tissue compliances will be considered fixed at some average value for speech, and not dynamically variable.
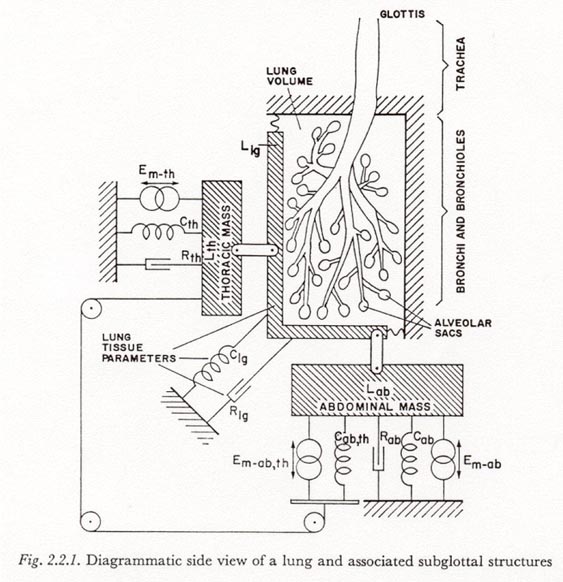
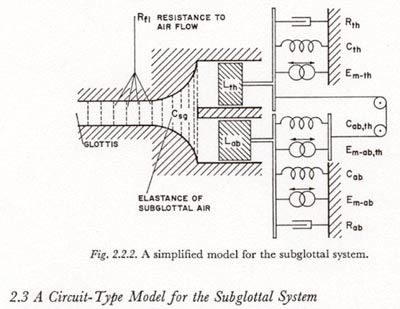
Figure 2.2.1 presents a diagrammatic view of a normal human lung and associated structures, illustrating the function of some of the mechanisms involved. The relationships indicated in this diagram will be developed in the following paragraphs.
The lungs are enclosed in the thoracic cavity along with the heart and other mediastinal structures. However, since no structures within the thoracic cavity except the lungs are compressed significantly with a change in cavity volume, we may assume air-containing chambers within the lungs are the only compressible portions of the contents of the thoracic cavity. Therefore any change in the volume of air contained in the lungs must be accompanied instantaneously by an equal change in the volume of the thoracic cavity. Such volume changes can be considered to occur in one of two ways: (a) by the movement of the walls of the thorax (the chest wall) or (b) by a movement of the diaphragm and underlying abdominal structures. In Figure 2.2.1 these two components of volume change are represented by the respective horizontal and vertical movements of the lung mass, Llg.
The model of Figure 2.2.1 assumes that the thorax wall and abdomen are incompressible and that each moves as a unit. It is assumed that there is no pneumothorax, and the small amount of air that may be found in the abdomen is ignored, resulting in a tight coupling between the lung mass and the thoracic and abdominal masses, respectively. The model of VAN DEN BERG contains these assumptions.
It is also assumed that the heart is firmly coupled to the diaphragm, and that the total effect of the heart and other contents of the mediastinum may be represented by a mass added to that of the contents of the abdomen. Any reference to 'abdominal' mass will hereafter be considered to include the mediastinal component. (This follows VAN DEN BERG’s terminology, though the term 'diaphragmatic mass' may be more explanatory.) There is probably some movement of the mediastinal mass also present in movements of the thorax, but this will be neglected.
Pressure variations in the subglottal system can be generated by sources at or above the glottis (such activation is not represented in Figure 2.2.1) or by control of the activation of the various muscles of respiration. It is usually assumed in the study of pulmonary function that there are no active elements within the thoracic cavity. The heart muscles have a negligible influence on breath dynamics, and the smooth muscle covering most of the pulmonary airways is under autonomic control and is considered to participate only in determining the passive characteristics of the airways and tissues.
In Figure 2.2.1 the effect of respiratory muscle activity has been represented by a network of three constant-force sources (as discussed in Section 2.1 above) acting on three compliances. This network should only be considered as a functionally equivalent representation for the complex network of muscles, tendons, fascia, etc. that acts on the walls of the thoracic cavity. The goal is to retain only the degrees of freedom of the original system, not its actual structure. From the assumptions that there are two relatively independent movements that can change lung volume, and that the thorax and abdomen move as a unit, it follows that there are eight possible types of functions for the various respiratory muscles:3
(1) raise the thorax with no action on the abdomen;
(2) lower the thorax with no action on the abdomen;
(3) raise the diaphragm with no action on the thorax;
(4) lower the diaphragm with no action on the thorax;
(5) raise the thorax and lower the diaphragm;
(6) lower the thorax and raise the diaphragm;
(7) raise the thorax and raise the diaphragm;
(8) lower the thorax and lower the diaphragm.
The last two actions are inherently partially self-canceling and do not appear to be used appreciably in producing thoracic volume changes. The remaining 6 actions are composed of three pairs of opposing actions. (For example, actions 1 and 2 oppose each other in acting on the thorax.) For each of these three pairs we will define a respiratory muscle activity function (constant-force source) as follows:
Em-th = net muscle activity acting only to lower the thorax
Em-ab = net muscle activity acting only to raise the diaphragm
Em-ab,th = net muscle activity acting to lower the thorax and raise the diaphragm.
These are the muscle activity functions shown in Figure 2.2.1. They act across the compliances Cth, Cab and Cab,th which are associated, respectively, with movements of the thorax, movements of the diaphragm, and movements of the abdomen relative to the thorax. The muscle activity function, Em-ab,th, which acts on both the thorax and abdomen, transmits an equal force to both of these masses via the diagrammatic wire and pulley arrangement.
Fibers from one muscle may contribute to more than one action. For example, if a particular muscle contributing to Em-ab,th exerts a more effective force toward lowering the thorax than raising the diaphragm, the additional tension would be represented in Em-th.
The elements Rth and Rab in Figure 2.2.1 represent (dissipative) resistance to movements of the thorax and abdomen, respectively. The parameters of the lung tissues are as marked.
When studying the pressure-velocity pattern accompanying a plosive release, there are a number of simplifications which can be made in the model given in Figure 2.2.1, especially when we consider that the time constants of interest are all longer than 3 or 4 msec. VAN DEN BERG has suggested that joining the parallel branches of the bronchial tree into one pathway with an equivalent resistance, inertance, and elastance will be accurate for frequencies up to 3000 Hz (VAN DEN BERG, 1960). FANT (1960) points out that for the time constants of interest the inertance of the air is negligible. Since we have considered the lungs to be tightly coupled to the chest wall and diaphragm, the inertance and compliance of the lung tissue can be lumped with those of the chest wall and abdomen, and since they do not appreciably affect the total, they can be neglected (VAN DEN BERG, 1960). The resultant simplified model, in a more schematized form, is shown in Figure 2.2.2.
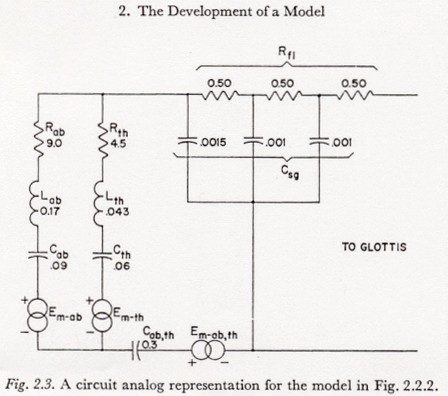
2.3 A Circuit-Type Model for the Subglottal System
Figure 2.3 presents a circuit analog representation for the simplified model of the subglottal system in Figure 2.2.2. Some typical, order-of-magnitude values are included in this figure. The units are the acoustic units listed in Table 2.1.1.
Figure 2.3 is a direct transformation of the mechano-acoustic model of Figure 2.2.2, except for making Csg and Rfl discrete. The distribution of Csg and Rfl along the tracheo-bronchial tree is discussed by VAN DEN BERG (1960). The largest RC time constant in the discrete version of the tract in Figure 2.3 is less than 1 msec, indicating that the subdivisions are fine enough for a study of the average air flow and pressure relations.
Typical values for air flow resistance, tissue dissipation resistance, lung volume (for computing the volume-related capacitances4) and average net pulmonary compliance can be obtained from a number of sources, for instance from the Handbook of Respiration (National Academy of Sciences, 1958). The values noted in Figure 2.3 roughly agree with the values assumed by VAN DEN BERG. It should be noted, however, that tissue compliance varies greatly with the degree of contraction of the respiratory musculature. The values shown are derived from measurements in a rather relaxed state and might be rather high for normal speech. This problem of the variation of tissue compliance is also mentioned by VAN DEN BERG.
The effective mass of the lungs, chest wall, abdomen, etc. are not usually found in the literature on respiration. The values for the total effective mass associated with movements of the thorax and diaphragm (Lth and Lab, respectively) were taken from data and estimates given by VAN DEN BERG. VAN DEN BERG also suggests a 40-60 percent split for net pulmonary compliance between the thorax and abdomen, respectively. However, he does not discuss what proportion of the compliance is common to both the chest and the abdomen. Since no other experimental or theoretical estimates were found in the literature, and since it was not important for the purposes of this study to have reliable estimates of the relative values, the distribution of compliance shown was determined from a superficial consideration of the anatomy of the structures involved and is presented only as an initial, order-of-magnitude estimate. The division of tissue resistance between the thoracic and abdominal branches is a similarly crude estimate and differs slightly from the estimate made by VAN DEN BERG.
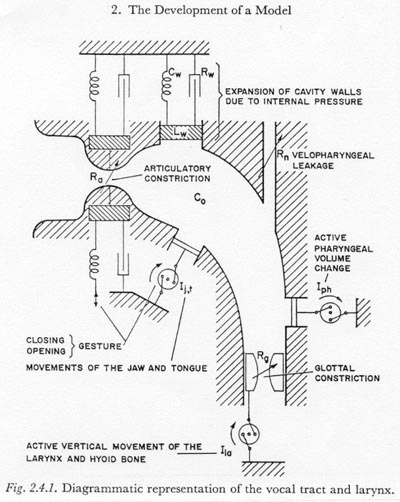
2.4 The Glottal-Supraglottal System
Figure 2.4.1 presents a highly diagrammatic representation of the larynx and those supra-laryngeal structures which may be important in the breath-stream dynamics of simple-released-plosive production. Since we have restricted our model to those plosives not having multiple articulations, it is only necessary to represent one major constriction or closure besides that at the glottis and that formed by the velum. Some other explanatory notes are as follows:
(1) The shapes of the oral and pharyngeal cavities are presented in only a suggestive and diagrammatic manner, since, as we have already noted for the subglottal system, the inertance of the air within the supraglottal cavity is negligible for the time constants of interest (and therefore the particle velocity distribution is not significant). The compliance of the air in the cavity is adequately described by a single compliance Co determined from the total volume between the larynx and the point of articulation (see footnote 4).
(2) Air flow resistances, except at the glottis and at the point of articulation, will be considered negligible. This may be slightly inaccurate for high volume velocities at points of partial obstruction such as the false vocal folds, the epiglottis, and the lips (when the place of articulation is not labial). The factor of air flow resistance may also need reconsideration in the case of the unilaterally or bilaterally exploded plosives.
(3) For most manners of articulation and phonetic environments, the velopharyngeal passageway may be considered tightly closed. However, the possibility of some air seepage past an almost closed velum cannot be neglected. This may be an incidental trait of a given individual’s pronunciation, or it may be phonetically significant, as when contributing to the production of a stronger or longer voicing in a voiced plosive (see Chapter 7 below). Some nasalization during the plosive closure is probably common in many languages in the nasal, voiced-plosive sequence. (In such cases the nasal articulation becomes a plosive articulation as the velum is raised.)
(4) The representation of the articulatory orifice is extremely simplified and suggestive. The component arrangement is intended to indicate that the articulators may be exploded open, even as they are pulled apart, and secondly, that there may be some tendency for the articulators to oscillate (FUJIMURA, 1961). Due to the lack of sufficient knowledge of the physical and physiological properties of the articulators, in this work we will usually consider the articulatory constriction to be a time-varying constriction, specified by the variation of its dimensions in time.
(5) Likewise, it is beyond the scope of this work to consider the glottis in detail. It will usually be considered to have the properties of a time-varying constriction.
(6) According to the conventions set forth in Section 2.1, the representations used in Figure 2.4.1 for the articulatory, glottal, and velopharyngeal constrictions indicate only resistance elements with no inertance components. In this work the inertance component at all constrictions will be ignored unless otherwise stated. FLANAGAN (1958) and FANT (1960, p. 268) have argued that the inertance of the air stream through the glottal constriction can be neglected for frequencies well beyond those of interest in the study of plosive breath-stream dynamics. The theoretical arguments of FLANAGAN and FANT also apply to the articulatory and velopharyngeal constrictions where the length of the constriction (parallel to the air stream) is less than about one centimeter. For constrictions having a length considerably longer than one centimeter, the assumption of no inertance might have to be reconsidered if the faster variations in air flow are of special interest (such as during the first five or ten milliseconds after a release).
(7) Certain of the walls of the supraglottal cavity, especially the cheeks and lips, can move appreciably in response to pressure changes within the cavity. Since little of a quantitative nature is known about the function of passive (pressure-activated) movements of the supraglottal cavity walls in plosive production, it seems appropriate at this time to lump the passive dynamic properties of the cavity walls into the simple dynamic system composed of Rw, Lw and Cw.
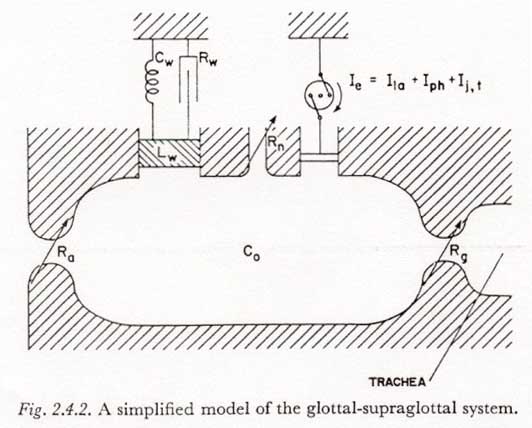
There is one additional simplification that can be made in the representation of Figure 2.4.1. Figure 2.4.1 suggests that there are at least three types of muscularly activated volume changes possible in the supraglottal cavity, namely a change in volume caused by moving the jaw or tongue, a change of the pharyngeal cavity cross section by activation of the pharyngeal muscles, and finally, a change of volume caused by lowering the larynx and hyoid bone. In view of our present sparse knowledge of the nature and degree of these separate actions, it seems appropriate to lump these muscle-activated volume changes into one function, Ie. [The subscript ‘e’ can be thought of as standing for ‘enlargement’, since this is the more common and the more important direction of volume change in simple-released-plosive production (Chapter 7).] Supporting this simplification is the observation that the effect of a vertical movement of the larynx, Ila, on the subglottal pressure is small (Section 4-3). The resulting simplified mechano-acoustic model for the glottal-supraglottal structures is shown in Figure 2.4.2. As discussed above, the articulators and the glottis are represented by time-varying constrictions.
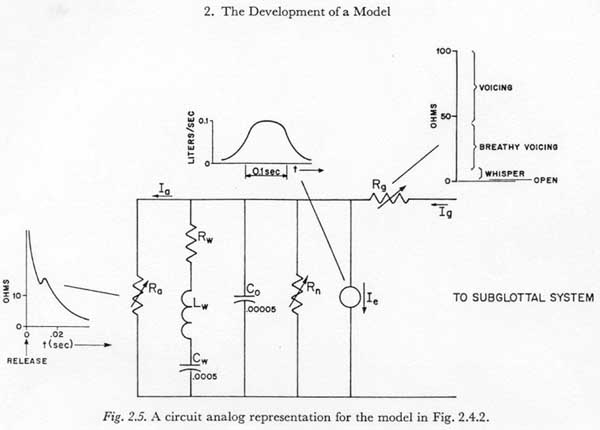
2.5 A Circuit-Type Model for the Glottal-Supraglottal System
Figure 2.5 presents a linear, lumped-parameter circuit analog of the model of Figure 2.4.2, with order-of-magnitude values indicated for some of the parameters. When connected to an activated subglottal system model (Figure 2.3), and given appropriate muscle activation voltages Em-ab, Em-th, and Em-ab,th, and resistance functions Rn, Rg, and Ra, the variations of Ig and Ia should be approximately proportional to the volume velocities at the glottis and articulators respectively.
I am not aware of any estimates of the properties of the cheeks and lips which would be sufficient to evaluate Rw and Lw under the various conditions of muscle tension. Rn was not estimated in this study, and no directly pertinent information was found in the literature. This parameter is considered to some extent in Chapter 7. The values indicated in Figure 2.5 for Ra, for Rg, and for Co, Cw, and Ie are taken from the data discussed below in Chapters 5, 6 and 7, respectively.
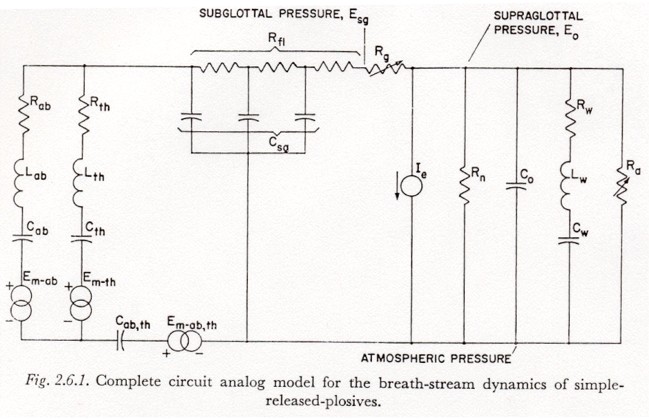
2.6 A Complete Model for the Breath-Stream Dynamics of Certain Simple-Released Plosives
A model for the complete subglottal-glottal-supraglottal breath controlling system, incorporating all the simplifications and the resulting restrictions presented so far, is shown in Figure 2.6.1. The model for the subglottal system (Figure 2.3) is shown connected to the model of the glottal-supraglottal system (Figure 2.5).
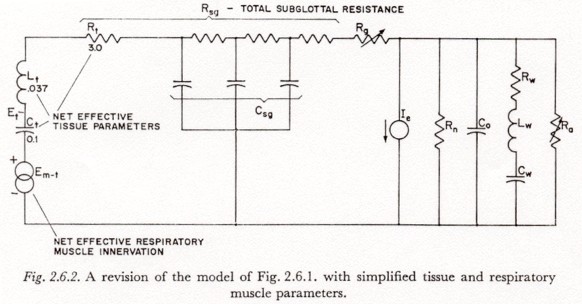
However, for most of the studies discussed below, the three-element representation for tissue compliance is still too complex. It is only useful to differentiate between the functional groupings of fibers in which energy is stored if we can intelligently assign a distribution of tensions to these various groupings. There seems to be little or no evidence as to what such a distribution should be, or how it varies with age, posture, breathing habits, etc. (There have been studies of the change of breathing habits with age, but these studies are mainly concerned with the use of the inspiratory muscles in normal respiration.)
Due to the difficulty of specifying a realistic distribution of muscle tension (see, for instance, Section 3.8), where such tension is not important to the discussion, the simpler model of the subglottal system in Figure 2.6.2 will be used. In this model, all tissue compliances have been lumped and the thoracic and abdominal masses have been combined. The estimates given for Lt, Rt and Ct were obtained from those of Figure 2.3 by connecting the node between Cab and Lab to the node between Lth and Rth.
Last Chapter |
Next Chapter |