| Publications of Dr. Martin Rothenberg: |
Research Aspects of Singing, Pub. No. 33 of the Royal
Swedish Academy of Music, Stockholm, pp. 15-31, 1981.
|
The Voice Source in Singing
by professor Martin Rothenberg, Department of Electrical and Computer Engineering,
Syracuse University, Syracuse, New York
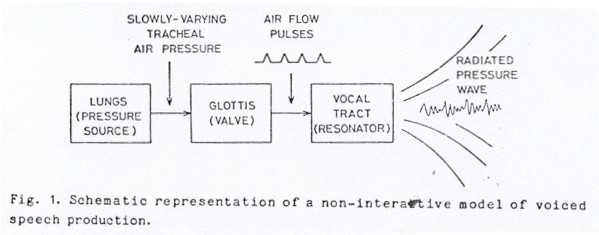
The acoustic theory of speech production, as first proposed and as generally now implemented in formant-based speech synthesis, models the speech production mechanism during vocalic sounds with three relatively independent subsystems (Fant 1960, Flanagan 1972). These subsystems, shown diagrammatically in Fig. 1, are (1) the respiratory system, which produces a slowly-varying tracheal air pressure, (2) a time-varying glottal flow resistance whose valving action creates quasi-periodic air pulses, and (3) a supraglottal vocal tract that shapes the spectrum of the glottal flow pulses. Though each of the systems interacts with the other two systems to some degree, order-of-magnitude calculations, model studies and early measurements have indicated that for many applications it is sufficient to consider these three subsystems as operating independently, at least during voiced sounds with no strong supraglottal oral constriction.
However, as we look for more precise models of the voice source, whether this
be for higher quality speech synthesis, the synthesis of the singing voice,
or the study of voice pathology, it is necessary to return to an interactive
model. This paper presents a model of the voice source that includes in a relatively
simple way the acoustic interaction between the voice source and subglottal
and supraglottal systems, in order to see what effect this interaction might
have on the singing voice.
If we look at the minimally breathy and relatively tonal (not purposely rough or aperiodic) voice most common in singing, we find that the vibrating vocal folds open and close periodically to allow puffs or pulses of air to pass from the trachea into the pharynx. The period of these pulses (time between repetitions) is the basic determinant of the pitch of a sung note, while the waveshape of the airflow pulses (the shape of the plot of flow vs. time within each pulse) helps determine the quality of the note. Since the acoustic interaction we speak of here affects primarily the voice quality, and not the pitch, we will concentrate on the quality of the voice in the following discussion.
The pattern of vibration of the vocal folds during voice production is often described by the "projected glottal area," (abbreviated here as PGA), i.e., the area of the opening that would be seen from directly above or below the glottis. Measurements on high speed or stroboscopic motion pictures or from recordings of the light projected through the glottis from a source either above or below (the "photoglottograph" technique) have shown that the waveform of projected glottal area tends to consist of rather triangular pulses separated by flat portions at or near zero area. The former represent the open portions of the glottal cycle, while the latter represent the periods during which the folds are closed at some level along their vertical dimension. The apex of the triangle is often (but not always) found to be rather pointed. This pointed triangular appearance, when it occurs, is generally believed to be due to a phase difference between the movements at the upper margins and lower margins of the folds. The rising segment of the triangle would represent the area at the upper margins of the folds as they open (the lower margins having opened previously do not effect the projected glottal area during this period). The decaying segment represents the area at the lower margins of the folds as they close (while the upper margins are still open). The triangular area pulse (whether pointed or rounded) can have a small dissymmetry, either to the right (with the opening phase slower than the closing) or to the left, but tends to be rather symmetrical.
The significance of projected glottal area (POA) in simple models of vocal tract acoustics is that if during the glottal cycle the variations in air pressure just inferior and superior to the glottis were relatively small compared to the average transglottal pressure (the condition assumed in the non-interactive model for voice production), the waveform of the volume air flow (volume velocity) through the glottis would tend to have a shape rather similar to that of the projected area, and it is this glottal flow that supplies the acoustic energy to the vocal tract for voice production.
However, the glottal air flow (abbreviated here as OAF) during voice production has been generally found to have a waveform which is considerably more tilted to the right than is the POA waveform, especially during open vowels (Miller 1959, Holmes 1963, Lindqvist 1965, Rothenberg 1973). The typical GAF waveform will have a slower and smoother increase in the glottal opening phase, and a more sharply decreasing closing phase, without the peak at the apex that one can find in many POA waveforms. Acoustically, this difference is very meaningful, since the acoustic quality, or pattern of amplitudes in the harmonics or overtones, would be very different for these two waveforms, as explained below.
Fig. 2 shows some representative PGA and GAF waveforms to illustrate these differences. The two PGA waveforms 2a,b are approximations of PGA from a photoglottograph in which the light was introduced just below the thyroid cartilage, at the centerline of the neck, and picked up by a photocell at the back of the pharynx, just above the glottis. The glottis is not uniformly illuminated by the light source, as would be necessary for a true PGA measurement, however, since the light source is placed so that there is a clear band of light across the glottis, somewhere near the center of its length, the resulting waveform should show the general characteristics of the variation of glottal area. Waveform 2c is also an approximation of the PGA from measurements of the glottal width near its center. However, in this case the glottal width was obtained from frame-frame measurements of high speed motion pictures, taken from above.
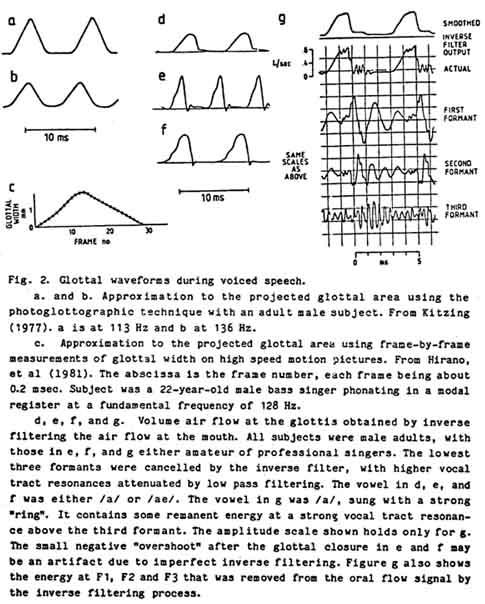
The three waveforms in Fig. 2d,e,f show some typical GAF waveforms during open vowels in speech arid singing. They were all obtained by the inverse filtering the air flow at the mouth, using a system with a response time of about 0.3 ms (Rothenberg 1971). This means that changes in the wave- form occurring in roughly 0.3 ms may actually represent a change in flow that was significantly faster. Note that the decay in air flow in these waveforms is considerably faster than the rise in flow. In the waveforms taken during singing, the time required for the final decrease in flow is close to or possibly below the response time of the measurement system. No such rapid termination of the glottal pulse has ever been reported in area waveforms.
The acoustic significance of the highly unsymmecrical flow waveforms has two
principal aspects:*
It should be added that the difference between a voice source that is weak at high frequencies and one that is strong is not just in the relative amplitude of the harmonics, but usually also in their periodicity. If we use a suitable band pass filter to isolate the third or fourth formant energy in the radiated acoustic wave, and observe the waveform on an oscilloscope, it can be seen that the strong voice will contain a relatively strong oscillation at the third, and usually also the fourth formant frequency (see Fig. 2, for example). The pattern in this oscillation will repeat itself very closely in every glottal cycle, i.e., the waveform of the formant energy will be very periodic or tonal. On the other hand, the waveform from the weak voice will often have energy at the third and higher formants that is not only weaker, but more variable in its strength and pattern in each glottal cycle, i.e., that is less tonal. This difference in tonality is significant in that it means that the weak voice cannot be made into the strong one simply by electronic or acoustic amplification of the higher formants. Such high frequency emphasis could partially correct the relative formant amplitudes, but could not improve the tonality.
(2) The smoother onset of the glottal flow pulse would mean that less high frequency acoustic energy was generated at that point. This means that with a highly unsymmetrical flow pulse, most of the energy at the second and higher formants will be generated at the instant of glottal closure. From the principles of frequency (or Fourier series) analysis it can be shown that a periodic flow waveform with only one discontinuity in slope (at closure) will have a distribution of energy in which the amplitude at the harmonics of the fundamental frequency tend to decay uniformly with increasing frequency, with the rate of decay depending on the sharpness of the cessation of air flow. On the other hand, a symmetrical flow pulse will have dips in the glottal spectrum near those frequencies at which the energy generated at the opening of the glottis is partially cancelled by the energy generated at the glottal closing, i.e., at which the interval between the opening and closing is an even number of cycles. If a formant of a vowel held at a constant pitch and articulation (as in singing) were to fall near such a "low-energy" frequency, it would not be as strongly transmitted, and the resulting vowel might not be expected to be as clear as in the single-excitation (unsymmetrical) case.
Thus, if the glottal flow waveform were to follow the area waveform, as predicted by early, non-interactive models of the voice source, there would be little carrying power to the voice, with vowels less distinguishable over the sound of a loud accompaniment than is the case with a "good" singer. Resonance effects at or above 3 kHz, such as the "singing formant" reported by Sundberg (1974), could improve the carrying power of the voice, by strengthening the higher frequencies, but, needless to say, if there were not already strong high frequency components in the spectrum of the voice source, it is doubtful that such effects could produce the richness of voice quality that can be heard with some singers.
It seems, therefore, that the key to the understanding of why the voice source in some people can have a spectrum rich in higher harmonics, and which can, if properly modulated by the supraglottal vocal tract resonance, carry clearly over the sound of most musical instruments, lies in an explanation of how the glottal air flow waveform can differ so markedly from projected glottal area and, more specifically, have a much more rapid termination of the glottal pulse.
In Table 1, I have listed four factors which could possibly contribute to this
type of flow pattern. Of the four, I believe that the fourth is generally the
most important; however, according to the present state of our knowledge of
the voice source, each could be significant under some circumstances.
|
Table 1
|
1. Asymmetry In Projected Glottal Area
2. Different Relationship Between Area and Flow Resistance During Opening and Closing Phases
3. Air Displaced By Vocal Fold Movements
4. Acoustic Energy Storage or Reactance Forces in the Vocal Tract
a) Potential Energy - Acoustic Compliance (Primarily due to the compressibility of air)
b) Kinetic Energy - Acoustic Inertance (Primarily due to the inertia of air flow)
The first entry in Table 1 emphasizes that the projected glottal area itself
can be significantly unsymmetrical, as in the example in Fig. 2c. Any dissymmetry
in the PGA would add to, or subtract from, the dissymmetry in GAF.
Proceeding to the second entry in Table 1, it should be kept in mind that the
model for the glottal aerodynamics that puts glottal flow admittance (the inverse
of flow resistance) largely proportional to projected glottal area is only a
simple first approximation. Consider two instants, one during the opening phase
and one during the closing phase, at which the PGA is the same. Though the projected
areas are equal, the configuration of the vocal folds can be quite different
(Baer, 1981), arid therefore, the glottal admittance values could be quite different.
The relationship between the shape of vocal folds and the resistance to air
flow is still not well understood; however, a better understanding of this relationship
may show that for some modes of vocal fold vibration, the admittance function
may be quite unsymmetrical even when title PGA waveform is symmetrical.
The third factor in Table 1 is the air volume displaced by the movements of
the vocal fold masses. One may think of this as the "hand clap" effect.
As the folds separate, the displaced air tends to reduce the net outward glottal
flow. Conversely, when coming together, the vocal folds displace an air volume
that increases the net outward flow. When these displaced air components are
added to the GAF waveform, the effect is to tilt the glottal pulse to the right
(Rothenberg 1973). However, rough calculations of the order-of-magnitude of
this effect indicate that it could cause only a small part of the dissymmetry
found in the more harmonic-rich of the naturally occurring glottal waveforms
(Rothenberg 1973, Rothenberg and Zahorian 1977, Flanagan and Ishizaka 1978).
At this time, it appears that the primary factor causing the GAF waveform to
differ from the PGA waveform is the fourth listed in Table 1, i.e., the influence
of the acoustic reactance in the vocal tract on the pressures and flows within
the glottis. The term "acoustic reactance" refers to the acoustic
energy stored in the vocal tract at any instant. When the energy stored as potential
energy, as in the compression of a volume of air, then the acoustic reactance
is referred to as a compliance. When the energy is kinetic, as in the inertial
energy stored in the velocity of the air flow at a constriction in the vocal
tract, the reactance is referred to as an inertance. When the 'voice fundamental
frequency Fo is below the first formant frequency, as is usually
the case, the reactive part of the supraglottal vocal tract impedance, as seen
from the glottis, is inertive at Fo. The subglottal acoustic impedance,
as seen by the glottis, also tends to be inertive for frequencies between the
highest respiratory tissue resonance (of the order of magnitude of 10 Hz in
adults) and the lowest acoustic resonance (of the order of magnitude of 400
Hz in adults, as can be seen in Fig. 3 below). From a simple model of the vocal
tract acoustics, it will also be shown that this type of inertive loading) of
the glottal source at Fo and its lower harmonics can and most likely
does cause a dissymmetry in the flow waveform of the type we have discussed
above.
The subglottal and supraglottal inertive loading of the glottis is shown diagrammatically in the sketch in Fig. 3. For simplification, the vocal tract is shown as a horizontal tube, with a simple constriction representing the glottal "valve". If we picture the air masses just before and after the glottis as more inertive (mass-like) than compliant (compressible), and the vocal folds opening after being closed a long time, it can be seen that there will be a "delay" or lag in the build-up in air flow after the vocal folds open, as the lung pressure acts to overcome the inertia of the air mass. This lag is shown by the left-most horizontal arrow in the sketch of the glottal area and flow waveforms. Conversely, as the vocal folds close to reduce the flow (the condition shown in the vocal tract sketch), there is an inertive force that resists the decrease in flow. This inertive force is actualized by a momentary, inertia-induced increase in pressure in the trachea, and a decrease in pressure in the pharynx caused by the inertia of the supraglottal air pulling it away from the closing glottis.
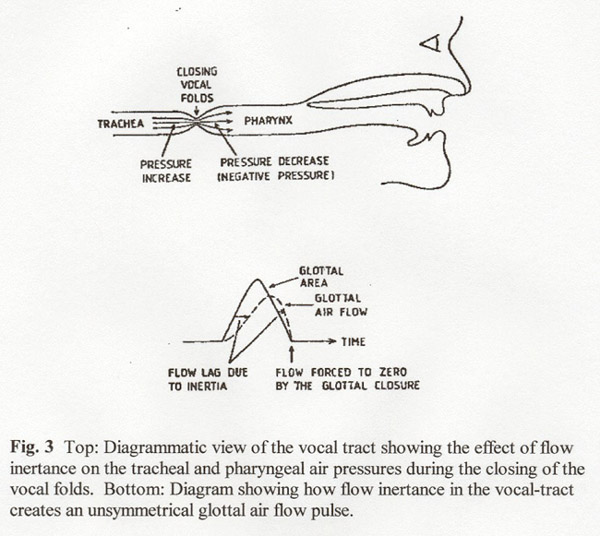
But the inertia of the air flow does more than just delay the build-up and decay of air flow. The important added feature is that although the decay of air flow is momentarily delayed, it must finally be forced to zero at the instant of complete glottal closure (assuming that there is a complete or almost complete closure). As shown by the sketch of air flow, the requirement that the flow be zero at closure causes a sharp drop in flow just before the instant of closure that is so important in generating a strong high frequency spectrum in the voice.
Just how the vocal tract acoustic inertance affects the glottal air flow can be seen in simultaneous measurements of pressure below and above the glottis made by Koike (1980), and shown in Fig. 4. Koike used two miniature pressure transducers, one of which was suspended just above the glottis, and the other just below the glottis, with the connecting wire to the lower one passing through the glottis at its posterior end. On the figure, I have drawn in an approximation to the projected glottal area, assuming a typical waveshape, and an instant of complete glottal closure that occurs at the (simultaneously occurring) peak tracheal pressure and negative peak oral pressure. (In later measurements, Koike has verified photoglottographically that the instant of closure does indeed occur as shown in Fig. 4.) Also, for similar waveforms shown on a much smaller scale, but with numerical amplitude scale given, the reader is referred to Kitzing and Löfqvist (1975).
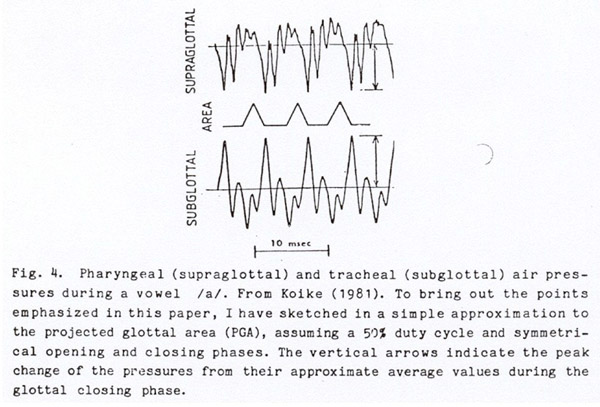
It can be seen in Fig. 4 that as the glottal area decreases, a strong negative pressure develops above the glottis, and an increased positive pressure develops below the glottis. The net effect is to increase the transglottal pressure which is forcing air through the glottis, so as to delay the decrease in air flow that would otherwise be caused by the closing vocal folds, as was shown in the sketch of Fig. 3. When the closing vocal folds finally do cause a cessation of flow, the inertia forces are suddenly terminated, and the supraglottal and subglottal pressures move rapidly toward their average values, in the oscillatory pattern caused by the respective resonances.
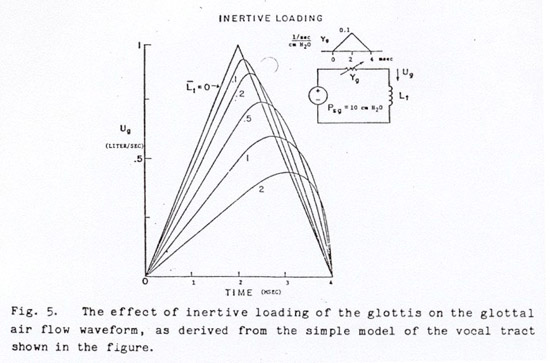
To see more quantitatively how the vocal tract acoustic inertance affects the glottal flow Ug Fig. 5 shows the solution to the nonlinear differential equation formed when the glottal admittance y is represented by the simple, symmetrical triangular variation of conductance (equals 1/Rg) shown at the upper right, and the acoustic impedances of the subglottal and supraglottal systems are combined into a single inertance Lt (Rothenberg 1981). Psg is the average tracheal pressure, and would be equal to the average alveolar or lung pressure if the dissipative flow resistance in the bronchi and bronchioles can be neglected.
The amplitude and time scales show values that might be expected for a male
voice at moderately high vocal effort. In a given situation, the effect of a
specific value of inertance depends on the amplitude of the glottal admittance
and the duration of the glottal pulse. To obtain a measure of the inertance
with a more invariant significance we have defined a normalized inertance Lt
with actual inertance Lt and normalized inertance Lt related
by the equation
| Eq. 1 | Lt = Lt 2Ygmax/tp |
where tp is the actual duration of the glottal pulse, and Ygmax
is the actual maximum glottal admittance. Thus, for this example, a normalized
value of Lt = 1 is equivalent to an actual Lt of .02,
in cm H20, l/sec units.
For the symmetrical admittance pattern in the figure, it can be shown that the
terminal slope of the air flow pulse becomes infinite for Lt = 1,
and the higher harmonics therefore become quite strong as the normalized inertance
approaches unity. For values of Lt less than about 0.2, the inertance
has little effect on the flow pattern; however, it can be shown that for non-breathy
open vowels the normalized inertance can always be expected to be at least that
value, with values of at least 0.5 attainable for most speakers during normal
speech.
Rough calculations indicate that it is at least possible that some individual voices could attain values of Lt of 1.0 and conceivably even as high as 2.0 with some pitch and vowel combinations. However, our knowledge to date of vocal tract acoustics does not permit the value of Lt to be tied down much more closely in the range 0.2 to 2.0. It appears though, that this is a crucial question in the understanding of voice quality. By simulating the voice source shown in Fig. 5, using values of Lt varying in the range of 0 to 2.0, and connecting the voice to a formant-type vocal tract analog, it can be shown that differences in the value of normalized vocal tract inertance of a magnitude that could conceivably be ascribed to physiological variations between individuals can make a very significant change in the quality and carrying power of the voice.
In future research we must therefore determine what the factors are that most strongly influence Lt. Are they vocal tract features such as the degree of pharyngeal. constriction? (A constriction in the flow path always tends to increase the inertance, since it increases the particle velocity at the point of constriction.) Or are there features of the vocal fold shape that influence Lt by changing the glottal admittance? (By equation 1 above, is proportional to the peak glottal admittance.) There is also the shape of the entrance of the larynx to consider, and the complex pattern of air flow within the laryngeal vestibule, as a jet of air emerges from between the vocal folds during the glottal pulse. The time-varying reactive components of the flow path between the vibrating vocal folds may also be a factor; however, our experiments with an analog simulation of the time-varying inertance at the glottal constriction indicate that because of its variation. In time this inertance does not add significantly to. (The relatively constant inertance of an emerging jet of air might be significant, however.)
From the above discussion it should not be included that acoustic interaction between the glottal source and the vocal tract is simply a matter of an inertive effect that is either more or less in a given voice. There are some other implications of this interaction which could be highly significant in our understanding of the singing voice. I will discuss here only two factors which seem to me to be the most significant.
First, I would like to mention only briefly that the degree of acoustic interaction is reduced when there is not a fairly complete glottal closure following the glottal flow pulse (Rothenberg 1981). Thus a voice that is breathy in the sense that there is never a complete glottal closure attained during voicing cannot develop the added carrying power that inertive vocal tract loading can bring.
Second, it is important to point out that source-tract acoustic interaction varies in type and intensity depending on the vowel (Rothenberg 1981). Vowels with a high first formant, such as /a/ or /ae/ (as in "father" and "hat," respectively) appear to have the strongest interaction of the type described above. When the first formant is low, or when the voice fundamental frequency Fo is high, so that the ratio F1/Fo is low the interaction can be much more complex and does not necessarily improve or strengthen the voice. Let us use FR to refer to the frequency of the lowest acoustic resonance of either the subglottal or supraglottal system. As the ratio FR/Fo is reduced, the interaction with the resonance energy becomes more important. As when FR/Fo is high, the significant factor determining the high frequency energy generated by the closing of the vocal folds is the pressure increase or decrease in the vocal tract near the glottis when the vocal folds are closing. As can be seen in the pressure recordings of Fig. 4, there are strong oscillations in pressure below and above the glottis due to the subglottal and supraglottal resonances, respectively. When FR/Fo is high (as in Fig. 4), these oscillations have time to decay between glottal closings, and have little effect. However, if the ratio FR/Fo is equal to or less than about three, then there may be a significant resonance-related peak in pressure occurring as the vocal folds are closing.
Considering the effect on supraglottal pressure first, if the timing is such that the first formant causes a positive pressure peak during the closing of the glottis, reducing the transglottal pressure, then the glottal air flow will be reduced prematurely, before the instant of glottal closure. This can greatly reduce the high frequency energy generated at the closure. Likewise, a negative pressure peak occurring while the vocal folds are closing will increase the transglottal pressure and thus increase the high frequency energy.
Though less is known about subglottal resonances than is known about supraglottal resonances, it is clear that a resonance-induced increase or decrease in tracheal pressure occurring while the vocal folds are closing can also affect the high frequency energy generated at the closure. An increase of tracheal pressure would increase the energy generated and vice-versa. However, the higher damping of a subglottal resonance (see Fig. 4, for example) means that it is less significant than a supraglottal resonance of comparable frequency in effecting voice quality.
At this time it is not clear to what degree a trained singer makes use of formant or subglottal resonance to enrich voice quality. Sundberg has shown that there sometimes appears to be a shifting of the articulation of a sung vowel so as to "tune" a lower order formant to the vicinity of a multiple of the voice fundamental frequency in female singing. However, is the singer's goal to increase the energy at the formant being tuned, as would be predicted by linear, non-interactive theory, or is this goal to enrich the voice spectrum at higher frequencies also, as would be predicted by the nonlinear interactive model? (It is interesting to note that the tuning of a formant for maximum high frequency energy is slightly different from the tuning for maximum formant energy, since the latter is always at an exact multiple of the fundamental, while the former may not be.) Also, is there a possibility of "tuning" the subglottal resonances? (This seems doubtful.)
Putting these questions another way, one can ask whether in some styles of singing the trained singer is not only trying to select vocal tract tunings that enrich voice quality but is also striving to avoid improper tunings which would dilute voice quality. Such tuning adjustments could be conceivably accomplished through small changes of vowel articulation which would vary with the note sung; however, there may be other, less obvious methods. For example, a slight nasalization can increase the damping of the vocal tract formants, and thus reduce the formant energy from a given glotttal pulse that is still present in the supraglottal system during the next closing of the vocal folds. Can nasalization therefore be used as a device to produce a more uniform voice quality as pitch is varied?
In conclusion, I would like to add some rather speculative remarks on the possible relationship between a nonlinear, interactive model of the voice source, the computer-based synthesis of the singing voice and the philosophy of singing pedagogy. It appears from the model presented above that a part of the task of the trained singer is to develop a style of singing in which the acoustic interaction of the voice source with the vocal tract tends to increase the acoustic energy at the second and higher formants produced at the instant of glottal closure. However, this must be done in such a way as to avoid large differences in voice quality as the voice pitch and the vowel are varied. In other words, the singer must learn to make use of the source/vocal tract coupling in improving voice quality, while avoiding or compensating for its undesirable effects. These may be awesome tasks for the human speech production mechanism, however, they are simple ones for the electronic voice. Electronically, one may set the richness of the "voice" spectrum at any level desired. Likewise, the voice source of the electronic voice can be easily isolated from the vocal tract it drives. If we add to these "advantages" of the electronic voice the ability to select the proper voice fundamental frequency to any desired accuracy, including the characteristics of pitch change and vibrato, we might conclude that the computer can be a better singer in some sense than a human being can be, at least during vowels. (Many consonants cannot be accurately synthesized as yet.)
Said differently, it may be possible that some aspects of classical singing pedagogy have been inadvertently aimed at making the voice a good "computer", just as some aspects of classical painting pedagogy were aimed at making the painter a good "camera". But I wonder if, in the future, we will find that the computer will easily outdo the human singer in producing "technically perfect" singing (accurate in pitch control, and rich and uniform in voice quality). And as that develops, may we not see a shift to more expressive singing styles that leave to the computer that which it does best?
ACKNOWLEDGEMENTS
Most of the concepts presented in this paper were developed during my tenure
during 1980 as a guest researcher in the Department of Speech Communication
and Music Acoustics at the Royal Institute of Technology in Stockholm. While
there, I had the benefit of many lengthy and fruitful discussions with staff
members, especially Professor Gunnar Fant and Dr. Jan Gauffin. I am indebted
to them for their help. Also, the remarks in this paper on the influence of
the first formant on source-tract acoustic interaction stem primarily from my
experience with an analog simulation, designed and constructed during my stay
there, of an interactive voice source model similar to that in Fig. 5, but including
elements simulating the action of the first formant. This simulation was connected
to the laboratory's singing synthesizer MUSSE for perceptual experiments. I
very much appreciate the assistance of Professor Johan Sundberg and Mr. Bjorn
Larsson, its designer, in connecting the interactive voice source to MUSSE and
in interpreting the results.
|
|