Publications of Dr. Martin Rothenberg:
Source-Tract Acoustic Interaction and Voice Quality
by Martin Rothenberg
Syracuse University, Syracuse, New York 13210
Transcripts of the Twelfth Symposium: Care of the Professional Voice, The Julliard School, New York City, June 6-10, 1983, The Voice Foundation, New York, NY, pp. 15-31, 1984.
I would like to discuss the physical factors that differentiate the strong or well-carrying singing voice from the weak or average voice. In this discussion I will be most concerned with the voice of a male singer singing open vowels, such as the vowel /a/, in modal or chest register; however, the principles discussed undoubtedly extend beyond these limitations. It has been long recognized that in this situation a strong voice invariably contains a higher than normal amount of energy near the third highest vocal tract resonance ("formant"), or at roughly 3000 Hz (Bartholemew, 1934). Besides helping to give the voice an aesthetic quality usually desired in operatic-style singing, this energy permits the voice to carry well over the sound of the orchestra, since most instruments have little energy at that high a frequency.
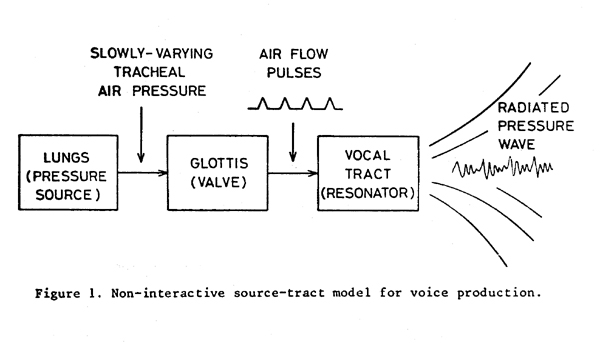
To see where this added energy can come from, let us examine the common source-tract model for voice production in Figure 1. In this model, the air pressure in the lungs provides the energy to set in motion the oscillatory glottal "valve", which in turn modulates the air from the lungs into a series of brief pulses. The repetition rate of these pulses, usually notated F0, determines the pitch being sung. The shape of the pulses, on the other hand, determines the potential quality of the note sung, with a smoothly-varying or rounded waveform containing little energy at the higher overtones, and a pulse with a sharp "corner" or change in slope containing relatively more energy at the higher overtones, just as the rapid cessation of air flow from between your hands as they meet in a hand clap produces the broad spectrum acoustic pressure impulse that we hear as a clap.
The air flow pulses from the glottis then passes through the pharynx, and the
oral and nasal cavities, where they are "resonated" at the natural
or resonant frequencies of this system of chambers. In other words, the energy
distribution in the pulses is modified so that the energy near
the resonant frequencies of the vocal tract is increased, and the energy between
these frequencies is generally decreased.
From the diagrammatic representation in Figure 1 we can see that the energy
near 3000 Hz can conceivably be increased in one of two ways. Either the energy
at that frequency in the glottal air flow pulses must be increased, by forming
a greater discontinuity of flow at some point in each pulse, or two or more
vocal tract resonances can be located in close proximity, near 3000 Hz.
Bartholomew has shown that the operatic "ring" is generally associated with two mutually-supportive resonances near 3000 Hz which concentrate energy in that frequency region, at least in the type of voice we discuss in this paper. Both he and Sundberg (1974) discuss the possible features of the vocal tract configuration that could cause two resonances to appear in a frequency range in which only one (the third vocal tract formant) is to be found during normal speech, and we shall not go into this topic further here.
However, vocal tract resonances do not create energy, they merely redistribute it in frequency, or in some cases use it more efficiently. For a voice to have a strong ring quality, there must also be a stronger-than-average distribution of high frequency energy in the glottal air flow pulses entering the vocal tract from the glottis. It appears at this point that much of this energy is generated by an acoustic interaction between the glottal source and the inertance (inertia of the air flow) that is present in the subglottal (lung and trachea) and supra-glottal air flow (Rothenberg 1981a and 1981b, Ananthapadmanaba and Fant 1982). This interaction is illustrated in Figure 2. For clarity, in this figure the trachea, glottis, pharynx and oral cavities are shown in a straight line, since the right angle bend in the actual air path does not appreciably affect the principles involved.
As the vocal folds oscillate during voicing in the modal or chest register, the area of the glottis varies in a rather symmetrical, triangular-shaped pattern, as shown in the center of Figure 2. The opening and closing phases do not usually differ in duration by more than a factor of two. If the pulse of air through the glottis had the same time variation (waveshape) as the glottal area, the voice produced would not have much high frequency energy and would sound rather weak.
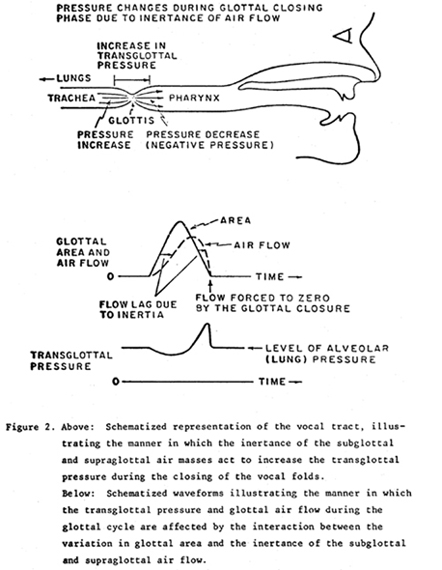
However, as shown in the figure, the buildup in air flow as the vocal folds separate is delayed, primarily by the inertia of the vocal tract air below and above the glottis. Likewise, as the vocal folds come together during each oscillation, the inertia of the air supports and maintains a high flow until the closing of the glottis finally forces the flow to zero (assuming a total glottal closure). Looking at the physics of the situation from another direction, we can see that as the vocal folds close, the tracheal air pressure will temporarily increase from the level supplied by the lungs (about 15 to 20 cm of water in chest voice singing at an average loudness). This increase comes from the inertia of the subglottal air, which acts toward supporting a constant air flow level while the glottal orifice decreases in area. A similar effect creates a temporary decrease in pressure just above the vocal folds, in the pharynx.
If we measure the tracheal and pharyngeal pressures while the vocal folds are opening, the opposite pattern can be found, with tracheal pressure decreasing, and pharyngeal pressure increasing, except that the effect will be weaker, and exist over a longer period of time.
Putting all these pieces together, we find that our simple model for the glottis and vocal tract leads to a pattern for the transglottal pressure (tracheal minus pharyngeal) similar to that shown at the bottom of Figure 2. It is this transglottal pressure, and not the underlying lung pressure, that drives the air flow through the glottal orifice. Actual measurements of transglottal pressure have verified that this pattern does indeed occur, except that oscillations in pressure at the supraglottal and subglottal resonance frequencies are added.
The resulting pulse of glottal air flow is shown as the dashed line in the middle of Figure 2. If the skewing of the glottal air flow pulse is sufficiently great, that is, if the interaction with the inertia of the vocal tract air is sufficently strong, the air flow pulse can exhibit a discontinuity in slope near the instant of glottal closure that is strong enough to produce the high frequency energy required stimulate the singer's formant, when this formant is present in the vocal tract.
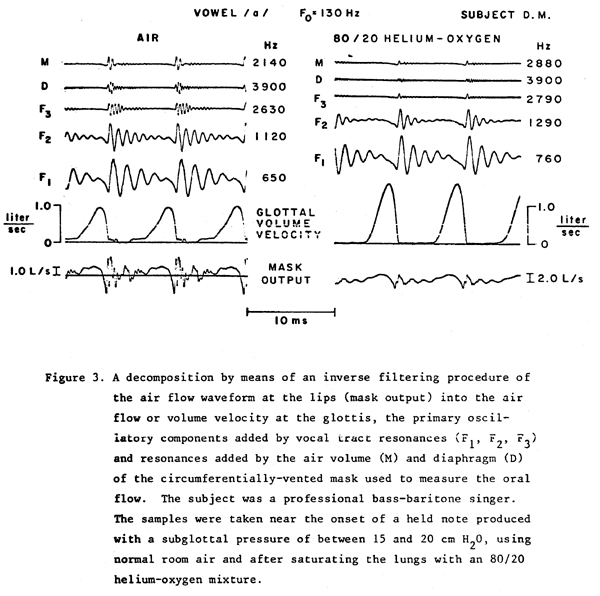
In other words, it is a regularly repeating series of these discontinuities, for example at 220 per second for A below middle C, that can provide the strong glottal tone needed for an operatic "ring". Figure 3 shows an example of the glottal air flow waveform of a trained bass-baritone singer. In the set of waveforms at the left he was singing the vowel /a/ in the operatic "ring" mode, at 130 Hz (C below middle C) with little or no vibrato. For the waveforms at the right he performed the same task, except that his lungs contained a mixture of 80% helium and 20% oxygen. By replacing the nitrogen in the air (normally about 80% by volume) with helium, we obtain a gas which is comfortably breathable, but considerably lighter than air, and thus has less inertia. In this way we can greatly reduce the effect of the flow inertia, if it is present. Helium-oxygen mixtures are widely used for deep underwater diving, and it is generally accepted that this type of modification of the respiratory gas is safe. Since the change in the characteristics of the gas affects the vibration patterns of the vocal folds very little, the voice fundamental frequency stays about the same. However, there is an increase in the vowel formant frequencies with helium, since the speed of sound in helium is higher than in nitrogen, and also an increase in the damping or rate-of-decay of the formant frequency energy (Fant and Lindqvist 1968, Richards 1982).
The subject attempted to make both the air and helium-oxygen productions at about the same subjective effort, with the same vowel set and laryngeal adjustment. The helium-oxygen sample was obtained near the onset of the note, before the subject subconsciously changed the vowel or laryngeal configuration to compensate for the gas characteristics.
(In later attempts to do this there was some probable alteration of the laryngeal configuration, as the subject apparently unintentionally learned to partially compensate for the altered sound balance by increasing the adduction of the vocal folds, in what is sometimes called a more "pressed" phonation.)
The bottom trace in each series in Figure 3 is the air flow pattern recorded by a special wire-screen pneumotachograph mask which we have developed in our laboratory. This mask inserts a small flow resistance into the air path, by means of a fine-mesh wire screen, and detects the resulting pressure drop across the screen as a measure of the flow rate. It is similar to the mask described previously (Rothenberg 1977) which fit over the mouth and nose, except that this version is much smaller, and captures only oral air flow by fitting around the outside of the teeth with the mouth open, with the lips falling on the outside of the mask to form a seal. Reducing the size of the mask in this way increases the potential fidelity by a factor of about two, and enables it to measure frequencies up to about 3000 Hz fairly accurately. For convenience in viewing, the air flow waveform at the mouth, as shown in the bottom trace, was reduced in amplitude from the scale used for all other traces.
The upper six traces in each column represent a decomposition of the mask output, representing the air flow at the mouth, into the glottal airflow (volume velocity), the oscillatory components below 3000 Hz added by the vocal tract above the glottis (labeled F1 through F3), and two oscillatory components in the mask output caused by the mask volume (M) and the resonance of the pressure-sensing diagram in the mask (D). This decomposition is obtained by means of an electronic circuit termed an "inverse filter", the operation of which is discussed in the literature and will not be detailed here (Rothenberg 1973, for example). Thus the traces in each column, if added together with the correct polarity, would yield the waveform shown at the bottom of the column.
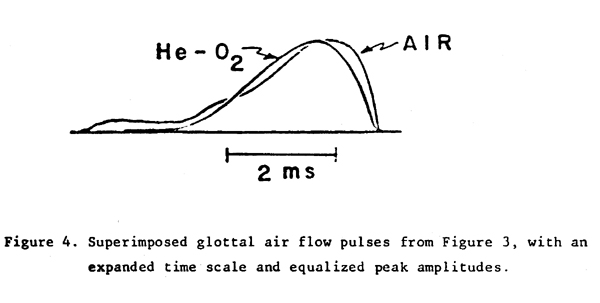
In order to allow a more meaningful comparison of the shapes of the glottal air flow pulses obtained, the segment of a glottal flow waveform cycle during which the glottal flow was significantly greater than zero was extricated for each gas condition, and the two segments superimposed in Figure 4 with an expanded time scale and equalized peak amplitudes. The phasing of the waveforms was chosen so ns to align the instants of glottal closure (the instants at which the glottal flow first attains zero, or a minimum near zero). Examining the trace obtained with air, we see that most of the decay in glottal air flow occurs in less than 1/2 of a millisecond, much faster than has ever been observed for the closing time of the vocal folds in this pitch range. It can also be seen from the air flow waveforms in Figure 3 that the stimulation of the vocal tract caused by the sharp discontinuity in the slope of the glottal flow excites the three lowest vocal tract resonances (F1, F2 and F3) into a pattern of oscillation which gradually decays during the period when the vocal folds are closed. (The closure can be assumed to occur during the period in which the measured glottal flow is near zero.)
Careful observation shows that the F1 and F2 oscillations decay in the smooth "exponential" fashion (following the curve e-t/T) that is a natural characteristic of a simple resonant system when it is excited (stimulated into oscillation) and then the resulting oscillations are left to decay. However, the decay of the F3 oscillations does not follow this type of smooth exponential pattern. Instead, the amplitude stays almost constant for about four cycles, drops sharply, and then appears to increase very slightly before finally decaying to zero. This type of pattern, though it could conceivably be caused by a multiple excitation of the vocal tract, is probably caused by the existence of two resonances near 2630 Hz, one being the normal third resonance or third formant, and the second, just above the third formant, being the "singing formant" mentioned above. The pattern seen for the decay in amplitude would be caused by the "beat" between the oscillations at these two resonant frequencies, Except for the time scale involved, the situation is closely analogous to the way the decay characteristics of some notes on a piano can be affected by staggering very slightly the tuning of the strings making up a unison. To hear the effect as a change in the decay characteristics, and not as a "beat", the offset in frequency between strings would have to be small enough so that the period of the beat (the reciprocal of the difference between the string frequencies) is similar to the decay time of a single string.
In comparing the relative amplitudes of the oscillations at F1, F2 and F3, it appears the amplitudes decrease with frequency. However, it should be noted that these curves are of flow velocity. The auditory impression of loudness is more closely related to acoustic pressure than it is to acoustic flow velocity. It can be shown that below about 3000 Hz the relative amplitude of the oscillations in pressure are increased with respect to the flow oscillations by a factor proportional to their frequency. (Mathematically, this relationship stems from the fact that the pressure is approximately the time derivative of flow velocity.) Thus, the F3 oscillations should be increased in amplitude by a factor of 2630 ¸ 650 when comparing them to the F1 oscillations. After allowing for this conversion from velocity to pressure, it can be seen that in this production the three formant oscillations shown are approximately balanced in their sound pressure, if the combination of F3 and the adjacent singing formant is considered to be a single formant. This balance is not to be expected in the normal speaking voice.
In comparing the waveforms using air with the waveforms using the helium-oxygen mixture we can see that the glottal flow waveform with helium is greater in amplitude and more symmetrical. Both of these characteristics could be predicted as a direct physical consequence of the decreased inertance of the gas. (The mask amplitude calibration with the helium-oxygen mixture was checked and found to be similar to the calibration with air, so that the waveforms can be compared directly.)
Since the discontinuity in the slope (rate-of-change) of the glottal flow waveform at the instant of glottal closure is not as great with helium, the higher frequency resonances of the vocal tract are not excited as strongly. The lowest formant, F1, is excited about as strongly as with air; however, F2 is excited slightly less than with air, and F3, in the range of the singing formant, is excited much less than with air. The fact that the formant resonances also decay more quickly with the helium-oxygen mixture must be due only to the characteristics of the gas and not related to the interaction with the glottis, since the glottis is closed during most of the decay. To avoid the effect of the decay when comparing the amplitudes of the formant oscillations, the amplitudes should be compared just after the cessation of glottal air flow, when the oscillations are greatest. The third formant excitation with helium is approximately a factor of 16, or 24dB, below the first formant excitation. Multiplying by the ratio of F3 to F1 to obtain the sound pressure equivalent, we still obtain a factor of four difference, indicating that the F3 excitation is about 12 dB below the F1 excitation. In air, this ratio would be more typical of an average speaking voice than a good singing voice.
Since the F3 waveform is so weak in the helium-oxygen production of Figure 3 it is difficult to determine whether there was still a singing formant. However, the apparent presence of a beat pattern in the wave-form indicates that there may have been two closely-spaced resonances near the F3 frequency.
Author's note: In the oral presentation of this paper, a tape as played of a short scale exercise using air and then the helium-oxygen mixture. However, the glottal waveforms for each case could not be compared easily, since the helium also changes the formant resonance frequencies and damping as noted above. To overcome this problem, a repetition of the scale exercise was also prepared in which the glottal waveform using the helium-oxygen mixture was derived by the inverse filtering procedure, then applied to an electronic vocal tract adjusted to have the same characteristics as the production made using air (i.e., with the F1, F2, F3 and singing formants matched in frequency and damping to the air production). Thus, in effect, we could let the audience compare the singer's normal voice with what the same voice would sound like if most of the source-tract acoustic interaction were removed. Due to the limitations of the equipment used for this experiment, only frequencies below about 3000 Hz were produced by the synthesis, giving a slightly muffled quality to the sound. However, when both the normal and synthesized voice were subjected to this same frequency limitation, one could hear the relative lack of richness in the tone produced with most of the interaction removed. A sample of normal voice with the singing formant removed was also included in the comparison, as was a sample synthesized from a helium-oxygen glottal waveform produced with an apparent "pressed" voice. In the future, we plan to redo the synthesis using a system having a broader frequency response.
In conclusion, we have outlined how in chest voice or modal singing, for open vowels, the stronger than average high frequency energy that is associated with a well-carrying voice can be produced in at least two ways, namely, by forming a vocal tract resonance just above the third formant, or by increasing the acoustic interaction between the time-varying glottal air resistance and the inertance of the air in the vocal tract. We have demonstrated that both these effects were present in the voice of one male baritone singer studied. Moreover, by decomposing his voice with air and with a helium-oxygen mixture, and reassembling it in various ways, we could demonstrate that both effects had a significant contribution.
A detailed study of the aerodynamics of voice production indicates that the
increase of source-tract interaction over the level found in the average speaking
voice can be due to a number of factors, such as an increased mobility of the
vocal folds as they oscillate, their configuration and speed as they come together,
and partial constrictions in the vocal tract, especially near the exit of the
larynx and in the lower pharynx. A primary goal in our current research is to
determine which factors are most significant.
Acknowledgement
The voice decomposition and resynthesis reported in this paper was performed with the cooperation of Richard Molitor, Nelson Correa and Professor Donald Miller. Professor Miller, of Syracuse University's School of Visual and Performing Arts, also provided the voice to be dissected. The work was supported by a research grant from the National Institutes of Health.
References
Ananthapadmanabha, T.V. and Fant, G. (1982): "Calculation of glottal flow and its components", Speech Transmission Laboratory - Quarterly Progress and Status Report 1/1982, Royal Institute of Technology, Stockholm, 1-30.
Bartholomew, W.T. (1934): "A physical definition of good voice-quality in the male voice", J. Acoust. Soc. Amer. 6, 25-33.
Fant, G. and Lindqvist, J. (1968): "Pressure and gas mixture effects on diver's speech," Speech Transmission Laboratory - Quarterly Progress and Status Report 1/1968, Royal Institute of Technology, Stockholm, 7-21.
Richards, M.A. (1982): Helium speech enhancement using the short-time Fourier transform," Ph.D. thesis, School of Electrical Engineering, Georgia Institute of Technology.
Rothenberg, M. (1973): "A new inverse-filtering technique for deriving the glottal airflow waveform during voicing", J. Acoust. Soc. Am. E, 1632-1645.
Rothenberg, M. (1977): "Measurement of air flow in speech", J. Speech Hear. Res. 20, 155-176.
Rothenberg, M. (1981a): "Acoustic interaction between the glottal source and the vocal tract", Vocal Fold Physiology, (K.N. Stevens & M. Hirano, eds.). University of Tokyo Press, 305-323.
Rothenberg, M. (1981 b) : "An interactive model for the voice source", Speech Transmission Laboratory - Quarterly Progress and Status Report 4/1981, Royal Institute of Technology, Stockholm, 1-17.
Sundberg, J. (1974): "Articulatory interpretation of the 'singing formant'",
J. Acoust. Soc. Amer. 55, 838-844.
|
|