Publications of Dr. Martin Rothenberg:
Source-Tract Acoustic Interaction in Breathy Voice
by Martin Rothenberg
Syracuse University, Syracuse, New York 13210
Vocal Fold Physiology: Biomechanics, Acoustics and Phonatory Control, I.R. Titze and R. C. Scherer, Eds., The Denver Center for the Performing Arts, Denver, CO, pp. 465-481, 1984.
INTRODUCTION
It has been shown that nonlinear acoustic interaction between the glottal source
and the low frequency inertance of the vocal tract (subglottal and supraglottal)
during normal voicing can cause a skewing of the glottal flow pulse to the right,
with a resulting increase in the high frequency acoustic energy generated at
the instant of glottal closure and decrease in the high frequency energy generated
by the opening of the glottis. For typical values of voice fundamental frequency
and formant frequencies, these variations in high frequency energy help determine
the energy at the second and higher formants, and therefore are an important
determinant of voice quality. For open vowels, the degree of this type of source-tract
acoustic interaction has been shown to depend on a dimensionless parameter which
we have previously termed Lt, the "normalized
inertance", but for which we will hereafter use the symbol a, adapting
a notation closer to that used by Fant (Fant, 1982), since the symbol Lt.
may imply that the parameter has the units of inertance (often symbolized L).
The interaction parameter a is related to the total subglottal and supraglottal
vocal tract inertance Lt as seen by the glottis by the
relationship
a = (LtGgmax)/(tp/2)
where tp is the duration of the glottal pulse, and Ggmax is the maximum value of Ug/Pg that would be attained during the glottal cycle if there were no vocal tract loading, i.e. if Lt, were zero, Pg being the transglottal pressure (constant and equal to the lung pressure PL if Lt = 0) and Ug the glottal volume velocity (Rothenberg, 1981a; Fant, 1982).
In this paper we will show that during breathy voice produced by an abduction of the vocal folds, the vocal tract inertance has an opposite effect; it reduces the energy at the higher formants by smoothing the flow waveform. The point of excitation of the higher formants remains at the instant of glottal closure, but, as observed by Fant (1980) this instant is moved toward the middle of the falling segment of the flow waveform (instead of being at the end of the falling segment as in normal voice), as the fundamental frequency component of the flow waveform is delayed by the interaction of the local tract inertance and glottal conductance.
Moreover, it will be shown that the amount of the delay in the fundamental
frequency component can be used to estimate a, the
vocal tract interaction parameter during normal voice, and therefore can be
used to test models for glottal source aerodynamics.
ANALYSIS DURING BREATHY VOICE
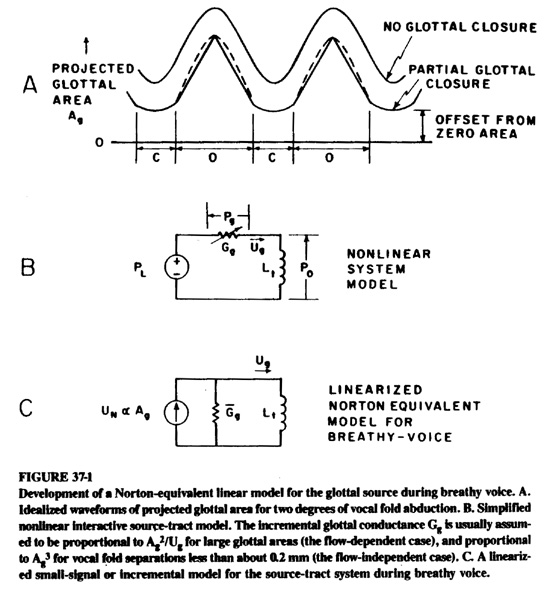
When the voice is made "breathy" by medial abduction of the vocal folds (and not by abduction of just the posterior interarytenoidal segment, as sometimes occurs (Rothenberg 1973), the projected glottal area can be expected to have the form shown in the lower solid trace in Figure 37-1. During the "open" segments, labeled 0, the folds are vibrating freely without any appreciable contact with each other. If there is a strong phase difference between the vibration patterns at the superior and inferior fold margins, the projected area (PGA) pattern will tend to be more triangular, with the upper margins defining the PGA during the opening phase and the lower margins defining the PGA during the closing phase. At the apex, the upper and lower margins would be approximately equidistant. This phase difference is generally believed to be less with more tension in the vocal folds, and the PGA would then tend to be more smoothly varying, or sinusoidal, as in the dashed trace in Figure 37-1.
During the C or "closed" phase, some segments of the vocal folds have come into contact, and the variation of PGA is therefore more limited. However, the PGA waveform during the C periods will generally not be perceived as completely "flat" or constant in amplitude, since the segments of the vocal folds that are not in contact are still in motion. The existence of contact during this phase is easily verified by means of an electroglottograph. The fact that not all of the vocal folds are in contact can be verified from the offset from zero area of the measured PGA waveform, or the offset from zero flow of the glottal air flow waveform. All of these features are illustrated in the example presented in the following section.
In this paper we will be examining the relationship between the glottal air flow and glottal area functions, using the simple model shown in Figure 37-1, in which the subglottal and supraglottal systems are represented by only their low frequency inertance Lt. This condition is approximated when the lowest supraglottal and subglottal resonances are at least about three times the voice fundamental frequency. The glottal orifice is represented by its conductance Gg = dUg/dPg, and the lung pressure PL is assumed to be constant.
Furthermore, it is assumed that the glottal conductance is determined by the PGA according to either the flow-dependent relationship Gg µ Ag2/Ug derived from kinetic energy considerations and usually assumed to be valid at larger glottal areas, or the flow-independent relation Gg µ F(Ag) derived by considering the viscous losses that are assumed to predominate at small glottal areas (van den Berg, et al, 1957). According to van den Berg's model experiments, the function F(Ag) is roughly proportional to Ag3, with the viscous losses predominating at glottal areas less than about 10 or 15 % of the maximum area during the glottal vibratory cycle associated with normal, non-breathy voicing. When the folds are not parallel, i.e., when they are narrowly separated at some points along their length, and widely separated at other points, then both relationships may hold simultaneously, however this complication is usually ignored in a simple analysis.
In order to correctly predict the flow pattern that would result from a given area function in non-breathy voice (in which the glottal area and air flow waveforms have little or no offset from zero), it is necessary to consider the nonlinear relationship between area and flow represented by the differential equation for the model of Figure 37-1B. Due to the strong degree of nonlinear interaction that can occur at small glottal areas, no linearization of the system equations can be made without introducing a significant error. However, if in breathy voice the offset from zero area is large enough, we can advantageously use a linearized small signal analysis in which PL and Gg are transformed into a Norton or flow-source equivalent network. The result is the model of Figure 37-1C in which the fictitious flow function UN appearing as a driving source represents the glottal flow Ug that would occur if Lt = O. The characterization of Gg usually assumed at larger glottal areas results in UN being proportional to Ag. This is because when Lt is zero, the transglottal pressure Pg is equal to PL and therefore constant. A constant Pg results in an essentially constant particle velocity vg when the glottal area is large (Fant, 1960). If vg is assumed constant over the glottal area, then Ug will be equal to vgAg, and therefore proportional to Ag. The bar over the dissipative element Gg indicates that it is an average value that is considered to be constant either at the value of dPg/dUg that occurs at the average glottal area during the vibratory cycle, or at the average value of dPg/dUg. These two values would converge as the offset from zero area became large compared to the variations in area over the glottal vibratory cycle.
In the form of Figure 37-1C, the system is easily identified as a first-order low pass system, with the waveform of Ag as input, and with Ug. the flow through Lt, as the output. The time constant of the system is given by the product LtGg, and the -3 dB frequency is 1/(2pLtGg).
To obtain order-of-magnitude estimates for the time constant and -3dB frequency of this source-tract low pass filter, we can estimate the average glottal conductance Gg as (1/2)Ug/Pg, where Ug and Pg are the average values during breathy voicing. The factor of 1/2 is introduced when the differential conductance is calculated under the flow-dependent conditions (Fant, 1960). Since Ug is roughly 1.0 liter/sec at normal voice levels, and Pg is closely equal to the average lung pressure, or about 6 cm H20 during breathy voice, Gg would be about 1/12 liter/cm H2O-sec. We have previously estimated (Rothenberg, 1981a) that for some vowels the supraglottal component of Lt can be as large as approximately .008 cm H20-sec2/liter. The relative contribution of the subglottal system, which was neglected in that reference, can be inferred from the relative magnitudes of the excess pressures just below and above the glottis at the instant of vocal fold closure during normal voicing (Koike, 1981; Rothenberg, 1981b). Since the subglottal overpressure is about 50% of the supraglottal under-pressure (very roughly), the estimate of Lt should be increased by a factor of 1.5, to .012. We may then estimate the source-tract time constant as:
tS-T = GgLt » (1/12) x .012 » .001 sec
The resulting -3dB frequency of the source-tract system is:
f-3db,S-T = 1/(2ptS-T) » 1/(2p(.001)) » 150 Hz
For a first order low pass system, the asymptotic attenuation above the -3 db frequency is 20 dB per decade, or about 6 dB per octave. Thus we see that the low pass action of the source-tract filter can be expected to significantly attenuate all the harmonics of the fundamental frequency, and, in fact, result in some attenuation and phase shift of even the fundamental frequency component.
That the source-tract interaction during breathy voice is significant should not be surprising, since Gg is much larger than in normal voice, while Lt can be expected to change very little, and the interaction varies directly with the time constant GgLt, However, we have just shown that the effect of this interaction on Ug during breathy voice is different than the effect it has on normal, non-breathy voice, in that it attenuates the higher harmonics for the breathy case, while it generally strengthens the higher harmonics in the non-breathy case; that is, the source-tract acoustic interaction tends to have an opposite effect on the high frequency spectrum in breathy voice, as compared to non-breathy voice. One consequence of this is that the interaction should tend to significantly increase the degree of spectral change at voiced-unvoiced transitions. We refer here to transitions in which the unvoiced speech segment is associated with a vocal fold abduction, and not with an adduction or glottal stop gesture.
Another effect to be expected during a voiced-unvoiced transition is a small decrease in the mice fundamental frequency (or increase in fundamental frequency during an unvoiced-voiced transition) as the phase shift at the fundamental frequency varies, since the frequency is the time derivative of the phase. The perturbation we refer to would be independent of, and would add in or subtract from, any changes in the timing of the glottal area oscillations. To obtain an estimate of the magnitude of the frequency perturbations, we can use the above rough estimate of 1 ms for the source-tract time constant during fairly breathy voicing, and note that this is the approximate delay at the fundamental frequency for fundamental frequencies not greatly removed from the source-tract -3dB frequency (150 Hz in the above calculation). During non-breathy voice, the phase shift between glottal area and glottal flow at the fundamental frequency is only about 1/2 msec for fundamental frequencies in this range (see, for example, the shift from the centerline of the peaks flows in the non-breathy simulation in Figure 37-6). If we assume that the transition from non-breathy to breathy voice occurs in about 30 ms, the average change in fundamental frequency during the transition would be (1-1/2)ms ¸ 30 ms, or about 1.5%, with a peak value of perhaps 2%.
Perturbations of the frequency of the fundamental component of this magnitude
would be detectable instrumentally, though they may not be of great perceptual
significance, coming as they do during a period of strong spectral change. In
addition, pitch perception may often depend more on the periodicity of the glottal
harmonics near the first and second formants, and therefore on the timing of
the instants of glottal closure, than on the frequency of the fundamental component.
However, the timing of the instants at which the vocal folds come in contact
also tends to be perturbed by about one or two percent during a voiced-unvoiced
transition, due to the fact that the contact occurs at a different point in
the vocal fold cycle as the folds are abducted or adducted, As with the interactive
effect, the perturbation would be a decrease in frequency during abduction and
an increase during adduction.
THE SIMULTANEOUS RECORDING OF GLOTTAL FLOW, GLOTTAL AREA AND VOCAL FOLD CONTACT
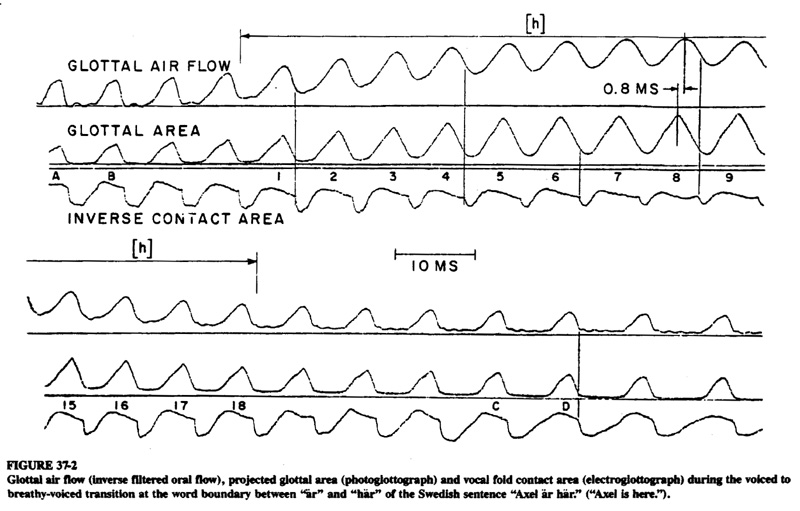
To illustrate the different effect of source-tract interaction in non-breathy and breathy voice, we show in Figure 37-2 simultaneous recordings of inverse-filtered oral air now, a photoglottograph signal and an electroglottograph signal. All three signals were recorded simultaneously on an F.M. tape recorder from a male adult subject pronouncing the Swedish sentence "Axel är här" ("Axel is here"), and written out on a Minograph ink jet chart recorder The segments chosen for Figure 37-2 are the onset and offset of the /h/ in "här", including a few glottal cycles before and after the /h/. The horizontal arrow above the air now trace indicates the approximate extent of the abductory movement for the /h/, as estimated from the three traces. The abductory movement encompasses about 18 glottal pulses.
The air now was recorded from a mask system similar to one described previously (Rothenberg, 1977), with a response time of about 1/4 ms, and inverse-filtered using formant values that were an average of those for the vowel just before the /h/ in "här" and just after it. The orthographic "r" in "är" is not pronounced in this context, and both the preceding and succeeding vowels have a rather high F1 (about 610 Hz and 710 Hz, respectively, for the sample recorded). Thus the estimate of glottal now in the top trace of Figure 37-2 has a small remanent formant ripple during the closed-glottis periods of the nonbreathy voice associated with each vowel, and is probably set fairly accurately for the central segment of intervening /h/. The zero level for the now trace was extrapolated from points of known zero now before and after the sentence, and should be accurate within ±2 mm, or 50 ml/s.
The delay introduced by the inverse filter reflects the sum of the glottis-to-mask transit delay and the delay due to any low pass filtering, and was measured to be 1.25 ms. The glottal air now trace in the figure was shifted left by the equivalent of 1.25 ms to account for this delay, and should therefore be in correct time alignment with the photoglottograph and electroglottograph traces. The chart recorder response time was less than 1/4ms, and the time alignment of the three channels was adjusted to be better than 0.2 mm, which was equivalent to about 0.6 ms.
The photoglottogram in the middle trace was recorded by placing a strong light source on the neck near the cricoid cartilage and picking up the portion of the light visible through the glottis with a photodiode at the end of a catheter inserted through the nose and running down the posterior pharyngeal wall to a point about 1 or 2 cm above the glottis. The positions of the light source and sensor were adjusted until a good signal was obtained. Observation of the light coming through the glottis by means of a laryngeal mirror placed in the oropharynx showed that the glottis was not uniformly illuminated, and that a strong signal from the photodiode was consistently associated with a band of light across the glottis near its center. Thus a glottal "chink" between the arytenoid cartilages, for example, would not be detected in the photoglottogram. However, a uniform return of the air now trace to near zero now during normal voice for this speaker indicated that he had a fairly parallel action of the two vocal folds, and therefore that the medial separation measured by the photoglottog ram would be closely proportional to the glottal area.
The response time of the photosensor was also checked at the light levels it was to be used at (since the response time of a photodiode varies with the light level) and found to be only one-or two-tenths of a msec. The step change in light required for the test was generated by a light-emitting-diode energized by a square wave generator. The upper zero line for the glottal area waveform was taken from the closed-glottis level of the adjacent vowels and is probably accurate. The lower zero line is taken from the initial glottal closure for the onset of the initial /a/ in "Axel", and probably has been affected more by drift than was the top zero line.
As one indication that the waveshapes of flow and area are mutually consistent, it can be noted that although the area trace tends to be triangular, there were some perturbations from a triangular shape near the apex in the non-breathy voice before the /h/. That these perturbations actually reflected changes in the area waveform, and were not just artifacts of the measurement system, is attested to by their presence in the inverse-filtered air flow trace, albeit in a smooth form due to the source-tract acoustic interaction.
The electroglottograph was a modified Laryngograph. The trace shown has the
polarity of inverse vocal fold contact area, so that a positive deflection indicates
a more open glottis. This polarity permits a more direct comparison with the
area and flow waveforms. Though the electroglottograph trace appears to have
a noise-generated cycle-to-cycle irregularity that is about 10 or 20 percent
of the signal generated by vocal fold contact area variations, the timing of
the rapid change in the waveform associated with the vocal fold closure is usually
clear. As illustrated by the four long vertical lines, the instant of vocal
fold closure comes closely just before the rapid drop in the IVFCA. This agrees
with measurements from time- corrected inverse filtered air flow (Rothenberg
1981c) and, incidentally, verifies the accuracy of our method for correcting
the timing of the air flow trace, which is the same as was used in that reference.
COMPUTATION OF a AND Lt FROM MEASURED GLOTTAL AIR FLOW AND AREA
In this section we will compute the value of the interactive parameter a during non-breathy voice1 from the glottal air flow and area waveforms in Figure 37-2, and show how the total vocal tract inertance Lt could be computed if PL were also known, using various models for the glottal source. Since the time scales in the figure and the accuracy of the inverse filter settings were not optimum for this purpose, it is not expected that the results will exhibit the accuracy that can be attained in this type of computation. However, it is hoped that the resulting measurements will have some significance, and that the procedures will illustrate how such measurements can be used in the future to test models of glottal aerodynamics, and help evaluate the mechanisms behind voice quality differences.
Turning first to the non-breathy voice immediately before and after the /h/, we have labeled the four non-breathy pulses closest to the abductory movement as A, B, C and D. It can be seen that the area waveform for these pulses is not symmetrical, even ignoring the perturbations at the apex. In each case, the rise time is about twice the duration of the fall time.
Footnote:
1 Since we will only compute a during non-breathy voice, for brevity we will
often delete the modifier "for the non-breathy voice" when mentioning
a, even though it varies from cycle-to-cycle with the degree of abduction.
A "skew factor" 0 characterizing this asymmetry in a manner convenient
for our purposes is defined as:
s = (rise time - fall time)/(rise time + fall time)
This factor can theoretically vary between + 1 and -1, and is equal to about +1/3 for the non-breathy pulses marked A, B, C and D in Figure 37-2. (During pulses C and D, the glottal period has started to increase, but this has resulted only in a greater interpulse interval as compared to pulses A and B, with little change in the shape or amplitude of the pulses.)
It can be shown (Rothenberg, 1983) that if F1 is much greater than F0, as in our example, the interactive parameter a can be related to the waveshape of a non-breathy glottal air flow pulse by using the ratio of the magnitude of the maximum slope of the falling segment, signified SF, to SR, defined as the maximum slope of the increasing segment with the oscillations at the frequency of the first formant "averaged out". The initial half of the increasing segment tends to be of rather constant slope, except that the slope immediately following the onset tends to be reduced by factors such as the time-varying acoustic inertance of the glottis and the viscous losses in the glottis at small glottal areas. Therefore SR could be measured at about 40% of peak flow amplitude, averaging over a short interval to eliminate the influence of oscillations at F1 (assuming F1 is much higher than F0, as in this case). The slope of the falling segment is measured at its steepest point, which, from simple models for source-tract acoustic interaction during non-breathy voice, would be expected to occur at or just before the instant of glottal closure, and therefore at or just before the minimum level of flow attained during the glottal closing phase.
The relationships between the slope-ratio so defined and a are shown graphically in Figure 37-3. The solid line shows the relationship that would exist if the glottal conductance was proportional to Ag2/Ug over its entire range (the flow-dependent case), and is derived from the solution to the resulting nonlinear differential equation (Fant, 1982). The dashed line is derived from a simple flow-independent assumption in which glottal conductance is assumed proportional to the area over its entire range.
Using the results of an analog simulation of a "combined" model (Rothenberg, 1983) in which the glottal conductance is flow-dependent at large areas and flow-independent at small areas, with Fg µ Ag, it can be argued that (1) for a wide range of the interactive parameter a in the combined model, the increasing slope will be similar to that predicted by a flow-dependent model, and also similar to that predicted from a simple flow-dependent model if the interaction parameter in the flow-independent model is made equal to one-half a, (2) at small values of a the terminal slope of the falling flow segment is determined by the flow-dependent model, in which case the same factor of two for a is required to match the results to the slope predicted by the simple flow-independent assumption, and finally, (3) that at large values of a the final slope should be determined by the flow-independent model, with a crossover between the two cases apparently occurring at about a = 1 for values of viscous (flow-independent) and kinetic (flow-dependent) loss similar to those measured by van den Berg and his associates (1957).
The heavy solid line in Figure 37-3 shows the result of these three conditions in the form of a plot of slope-ratio for the combined-source case as implemented in an analog simulation. Note that the slope-ratio for the combined source tends to break away from the plot for the strict-flow-dependent case when a is near unity. However, it should be emphasized that this plot is based on a number of coarse simplifications and assumptions that require experimental verification, especially the model used for the flow-independent glottal conductance at small areas, the precise nature of the glottal area function, and the glottal aerodynamics at small values of area during the closing phase. The plot is given here as a best available basis for predicting a from the slope-ratio.
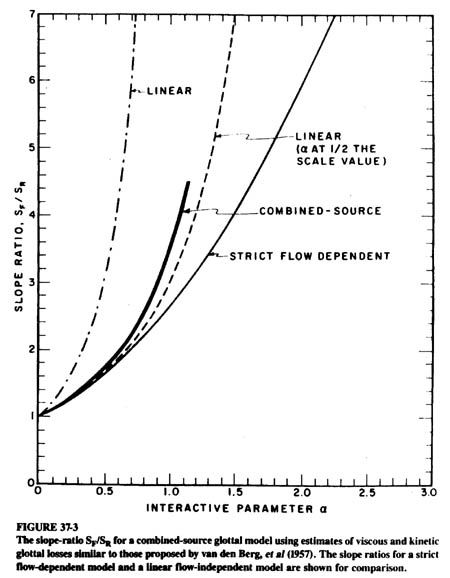
The curves in Figure 37-3 are for a symmetrical triangular area function. (The combined- source plot was actually obtained using a half-wave rectified sinusoid for glottal area, but adjusted to approximate the results for a triangular function.) It can be shown (Rothenberg, 1981b and 1983) that for a non-symmetrical triangular area function in the simple flow-independent case, the slope-ratio can still be read from the curve in Figure 37-3 if the ordinate scale is interpreted as reading a + s instead of a, where s is the skew factor defined above. Thus for an area function with a value of s of 1/3, SF/SR becomes infinite at a = 2/3 instead of at unity, for the simple now-independent case. Although no precise derivation can be presented at this time, it appears reasonable to assume that a skewing of the area waveform will have a roughly similar effect in the combined-source case, at least for small values of s.2
With the above theoretical basis laid, we have only to measure the slope-ratio from Figure 37-2, use the heavy trace in Figure 37-3 to determine a value of a that would apply for a symmetrical pulse, and finally subtract s = 1/3 to obtain a final estimate of a. Our graphical estimate of SF/SR is 3.5 for pulses A and B, 3.75 for pulse C, and 3.6 for pulse D. Taking into account (1) that the inverse filter was more accurately set for pulses C and D (there was less remanent F1 oscillation during the closed-glottis period), and (2) that an inverse filter frequency setting that is too high (as in pulses A and B) will tend to lead to an underestimate3 of the magnitude of the terminal slope SF, we might accept an estimate for slope-ratio near the higher end of the range for these pulses, or about 3.7. This value of slope-ratio would be generated by a value of a of about 1.03 if the Ag pulse were symmetrical. Subtracting a factor of 0.33 to account for the tilt in Ag, we arrive at a final value for a of about 0.70.
This final value is entirely reasonable in terms of our previous estimates of a possible range for the interaction parameter. However, note that by having an asymmetric glottal area pulse that tilts to the right, the subject has, according to our model, increased his slope-ratio from about 2.15 (the "symmetric" ordinate for a = 0.70) to a significantly higher value of 3.7.
We might also note here that to relate the interaction parameter a to the vocal tract inertance during the non-breathy and breathy voice, as we will do, the glottal pulses used should be produced with the same subglottal pressure, since a depends on unloaded glottal now, and this varies with subglottal pressure. However, by using non-breathy pulses both before and after the /h/, and a linguistic context without a marked rise or fall in stress, we can perhaps assume that the "adjusted average" slope-ratio of 3.7 is generated by an average non-breathy subglottal pressure that is close to the value during the intervening breathy /h/.
Let us now consider the case of breathy-voice. In Figure 37-2 we have numbered as one-through-eight a sequence of glottal pulses of increasing breathiness. On an enlarged copy of Figure 37-2, we connected positive and negative peaks of the flow waveform, and the average value of now at the center of each pulse. A slight adjustment of the negative peaks was made for the first few pulses, so as to obtain a value closer to the negative peak of the sinusoidal fundamental frequency component. After pulse three, the flow waveform itself is essentially sinusoidal.
The same procedure was followed for the area waveform, except that adjustment
of the peak value to obtain the peak of the sinusoidal component was needed
for all pulses. These judgements were made by the author by eye, on the basis
of a long experience with Fourier analysis.
Footnotes:
2 It is obvious that a cannot be adjusted by simply adding s
if the flow-dependent glottal source model prevails, since in this case the
maximum falling slope must become infinite as 0 approaches unity, but adding
s to a does not yield
that result. The exact relation between s, a
and slope-ratio, and approximate relations for the combined-source glottal model,
will be submitted for publication elsewhere (Rothenberg, 1983).
3 Since the error component at F1 has the phase of a cosine function when the inverse filter is set too high, it will obscure the final decay in air now by making it appear delayed by 1/4 cycle at F1.
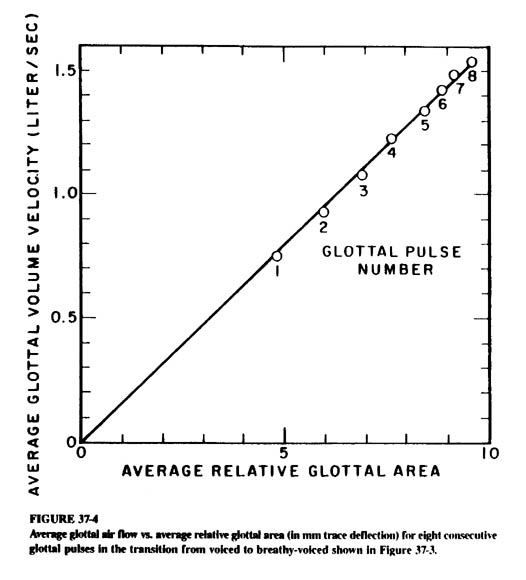
To test the consistency of the amplitude scales and zero settings. and to provide a calibration of the glottal area trace in terms of the resulting static glottal now, the average area was plotted against average now in Figure 37-4. The data fell close to a straight line going through the origin. indicating that volume velocity was closely proportional to the area as the area varied over a range of about 2:1. This would be the relation between now and area predicted by the now-dependent model for a constant average transglottal pressure when the oscillations in now and area around their mean values are small and the time constant of the increase in average area is large compared to the time constant for source-tract interaction.
Checking to see if these conditions held, we find: (1) The 1/e time constant of the increase in average area, about 30 ms is much larger than a typical source-tract time constant GgLt, of about 1 or 2 ms. (See, for example, the computations in this paper for a typical value.) (2) From the linguistic context and the similarity of the glottal now amplitudes before and after the /h/, we can assume that there was no great variation in subglottal pressure during this pulse sequence, though there may well have been a small variation of up to, say, five or ten percent that was not recorded in our procedure. (3) Since the variations in area and now for the first three individual glottal pulses were certainly not "small" compared to the average values, we should expect some deviation from the relation Ag µ Ug for these pulses. For a more accurate estimate of the error caused by a non-negligible ratio of the "a-c to d-c" components, one would have to return to the underlying nonlinear differential equation.
Comparing the area and now traces in Figure 37-2, we see that the now appears to be a low-pass filtered version of the area, with the low-pass action increasing at larger glottal areas. This is precisely the relationship predicted above from the source-tract acoustic interaction. We will now proceed to show one way in which the underlying vocal tract inertance and the parameter a can be estimated from the phase lag or delay caused by Lt. This was done for the glottal pulse numbered 8.
In the small-signal Norton equivalent model for the glottal source shown in Figure 37-1C above, the "input" is a now source representing the flow that would occur if the vocal tract impedance were zero. As generally assumed from the flow-dependent model, and verified for our example by the flow-area data of Figure 37-4, this source will have a waveshape similar to that of Ag for the larger values of area we are considering. The "output" is the glottal now Ug, which is acted on by the low pass filter formed by Gg (the average small-signal glottal conductance Gg) and 4. From linear system theory, we know that the time constant of this filter, GgLt, can be computed from the phase shift q at the voice fundamental frequency, F0, from the relation
tS-T = GgLt = 1/2pF0 tanqF0
where qF0 is the phase difference between the F0 sinusoidal components of Ug and Ag.
For pulse no. 8, the time lag Dt between the F0 components of Ug and Ag was measured to be 0.8 ms (after removing the 1.25 ms system delay in the air flow trace). This measurement was made graphically by bisecting a sinusoidal fit to each pulse (the short vertical lines in the figure). Because of the time scale in the figure, the accuracy of this measurement could only be considered to be about ±10%. The delay angle qF0 can then be computed as:
qF0 = Dt x 360F0 = (0.8 x 10⁻³)(360)(142) = 40.9°
and from (5) above
tS-T = GgLt = 1/2p(142)Tan 40.9° = 0.97 x 10⁻³
The conductance Gg in this time constant is the small signal value, dUg/dPg, and for the flow-dependent case is approximately equal to 1/2 the quotient of Ug and PL, with the factor of 1/2 being introduced in the process of differentiation (Fant, 1960). Reading Ug from Figure 37-4 as 1.53 liter/sec, we obtain in liter/sec, cm H2O units:
Lt = tS-T/Gg = tS-T/(1/2)(Ug/PL) = (0.97 x 10⁻³)/((1/2)(1.53/PL)) = 1.27 x 10⁻³ x PL
Using a typical value of PL, say 7 cm H2O, we see that Lt is approximately 9 x 10⁻³. However, we will see that PL is not needed in computing the interaction parameter a.
From the definition or a non-breathy voicing (Equation 37-1).
a = Lt (GgMAX)/(tp/2)
where Ggmax is the quotient Ugmax/PL that would occur if Lt = 0 at the peak area of a triangular glottal area pulse. and tp is the pulse duration, in this case about one-half of the glottal period. or 3.5 ms. Ugmax/PL was estimated to be 1.28 liter/sec by determining the peak of a non-symmetrical triangular pulse fit to a recorded non-breathy photoglottograph (relative area) pulse. and carrying over the peak relative area to flow, using Figure 37-4. The final computation yields
Since some of the above measurements could only be considered accurate to at
best ±10% or ±15%, a result of a =
0.93 can he considered a partial confirmation of the value obtained for non-breathy
voice (0.70). However. more significantly, this example does illustrate that
it is possible to obtain realistic estimates of Lt by
measurements during breathy voice.
It could be noted here that this procedure could have been carried out from only the air flow trace and the vocal fold contact area, making a non-invasive measurement possible. The timing information required for the delay measurement could he obtained from the VFCA function, as long as some small period of vocal fold contact remained during the glottal cycle. When the period of vocal fold contact is only a small fraction of the glottal period, the most-closed peak of the VFCA waveform can be expected to align well with the minimum value of the PGA waveform. If PL were available, then Lt could be computed fairly directly from the air flow and timing data. To obtain a, PL is not required, however tp and a peak unloaded glottal flow Ugmax/PL must be estimated from the non-breathy voice segment for which a is to be relevant.
Finally, we note that Lt could also be obtained from the degree to which the ac-to-dc ratio in the flow trace is smaller than the ac-to-dc ratio in the area trace. However, since the dc or average flow is not determinable from the small signal model, we would have to go back to the nonlinear differential equation for the flow-dependent case to determine the correct relationship between these ratios and Lt.
This is illustrated in Figure 37-5, in which the input to an analog model for the glottal source and vocal tract, using the "combined-source" case of Figure 37-3, was given the form and ac-to-dc ratio (relative offset from zero) of Ag of pulse 8 in Figure 37-2, and Lt then old adjusted to give the same ratio of ac-to-dc component for Ug as found in Figure 37-2, pulse 8. The value of Lt required to make this adjustment was similar to that computed above for Figure 37-2. The strict flow-dependent model gave a very similar result, since the glottal area never approaches the small values at which the combined-source and strict flow-dependent models differ most, however the value of Lt required was about 30% larger with strict flow dependence. The phase difference between the fundamental frequency components of Ag and Ug was also similar to that measured in Figure 37-2, for pulse 8. »45° from the model vs. 40.9° from Figure 37-2. Though the difference could have been due to measurement errors. a difference of this magnitude, if substantiated in other measurements of the same nature would indicate that there may be some significant inaccuracy in the models of laryngeal aerodynamics proposed so far. Alternatively, the discrepancy could be due to an inaccuracy in the simple model we use for the vocal tract. For example, we have neglected the resistive, and compliant elements of the vocal tract. Inclusion of the subglottal flow resistance in the model might have reduced the phase shift caused by the vocal tract inertance; however, the proper representation of this resistance would require a consideration of the distribution of inertance and resistance in the trachea, bronchi and bronchioles, and an estimate of the degree to which the resistance is flow dependent at the flow levels involved.
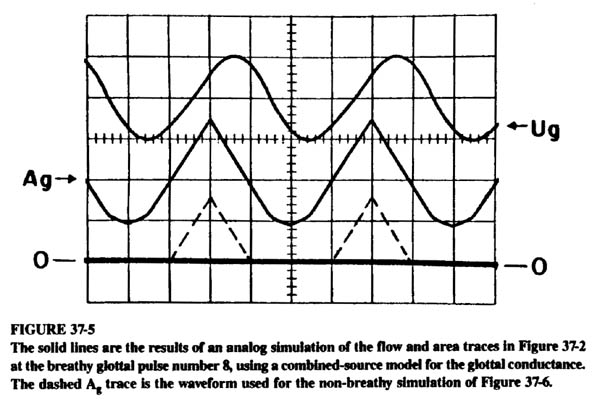
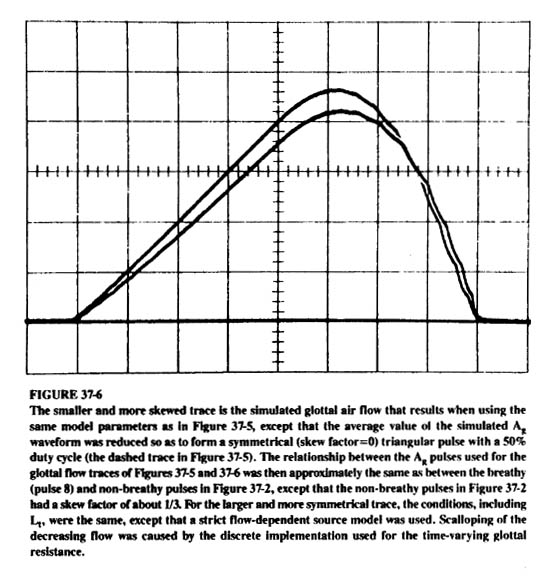
The value of Lt required to give the relationship between area and flow shown in the simulated breathy-voice of Figure 37-5 can be determined by changing the simulated Ag signal to a symmetrical triangular pulse with no offset from zero flow, to simulate non-breathy voice, and measuring the slope-ratio of the resulting simulated glottal flow pulse. This has been done in Figure 37-6, for two glottal source models. In each case, the amplitude of the triangular Ag pulse was kept in roughly the same proportion to the breathy Ag as was the case for actual the non-breathy and breathy Ag waveforms in Figure 37-2. The resulting slope-ratios, as measured from the waveforms in Figure 37-6, are as follows.
Top trace: Strict flow-dependent source, S.R. = 2.4
Lower trace: Combined source, S.R. = 3.2
The increasing slope for the combined-source trace was measured using the protocol indicated in the definition of slope-ratio.
In Figure 37-3, a slope-ratio of 2.4 for the strict flow-dependent case and 3.2 for the combined-source case would both be generated by a normalized inertance of about 0.95. Since we have used a symmetrical Ag pulse of about the same duty cycle and relative amplitude as in the non-breathy voice of Figure 37-2, this simulation value of 0.95 should be comparable to the measured values of a, namely 0.93 from the breathy voice and 0.70 from the non-breathy voice.
Again we have obtained a result of the correct order-of-magnitude, but differing from the non-breathy mice measurement by a margin somewhat larger than that which can be safely attributable to measurement errors. If replicated in future similar measurements, this result would indicate some inaccuracy in the aerodynamic models used. For example, assuming for the non-breathy voice in Figure 37-2 a strict flow-dependent source, or a source with flow-dependence to smaller values of Ag than assumed in our combined-source model, would have yielded a measured interaction parameter greater than 0.70 and closer to the simulation value of 0.95. The adjustment made for an unsymmetrical area pulse could also be inaccurate.
The simulation results can be summarized by saying that they confirm the general
validity of the models we have been using for glottal aerodynamics, and indicate
that a more accurate simulation study of adjacent breathy and non-breathy voiced
segments could be useful in deciding between the alternative aerodynamic models
presently proposed. However, to be maximally useful, an analysis-by-synthesis
study such as we have outlined above should be more accurately implemented,
possibly using a digital formulation of the appropriate differential equations,
with the actual Ag waveforms as "input" to the
simulation, instead of the idealized shapes we have used here. The criteria
we have used for goodness-of-fit, namely ac-to-dc ratio, phase shift at the
fundamental frequency, and slope-ratio, are proposed here as convenient and
meaningful measures, but by no means the only ones possible.
ACKNOWLEDGEMENT
The experiment from which Figure 37-2 was extracted was performed in cooperation
with Drs. Gunnar Fant, Ian Gauffin, Peter Kitzing and Anders Lofqvist, while
the author was a guest researcher at the Speech Transmission Laboratory of the
Royal Institute of Technology in Stockholm, Sweden. The data from that experiment
was largely responsible for directing my attention to many of the theoretical
issues treated in this paper. During the work reported here, the author was
supported by a research grant from the National Institutes of Health.
REFERENCES
van den Berg, Jw., Zantema, I.T. and Doornenbal, P. (1957). "On the air
resistance and the Bernoulli effect of the human larynx,' J. Acoust. Soc. Am.
29, 262-631.
Fant, G. (1960). Acoustic Theory of Speech Production. Mouton, S-Gravenhage.
Fant, G. (1980). "Voice source dynamics",Quart. Prog. and Stat. Rep.,
2-3/1980, Speech Trans. Lab., Royal Institute of Tech., Stockholm, 17-37.
Fant, G. (1983). "Preliminaries to analysis of the human voice source;'
Speech Commun. Group Working Papers #3, Res. Lab. of Electronics, MIT.
Koike, Y. (1981). "Sub- and supraglottal pressure variation during phonation;'
in Stevens, K. N. and Hirano, M. (Eds.) Vocal Fold Physiology. Tokyo: Univ.
of Tokyo Press, 181-189.
Rothenberg, M. (1973). "A new inverse-filtering technique for deriving
the glottal airflow waveform during voicing;' J. Acoust. Soc. Am. 53/1, 1632-1654.
Rothenberg, M. (1981a). "Acoustic interaction between the glottal source
and the vocal tract;' in Stevens, K. N. and Hirano, M. (Eds.) Vocal Fold Physiology.
Tokyo: Univ. of Tokyo Press, 305-328.
Rothenberg, M. (1981b). "The voice source in singing;' in Research Aspects
of Singing, Pub. #33 of the Royal Swedish Acad. of Music, Stockholm, 15-31.
Rothenberg, M. (1981c). "Some relations between glottal air flow and vocal
fold contact area;' Proceedings of the Conference on the Assessment of Vocal
Pathology, Nat'l Institutes of Health, Bethesda, MD., ASHA Reports #11, 88-96.
Rothenberg, M. (1983). "The effect of flow-dependence on source-tract acoustic
interaction;' J. Acoust. Soc. Am. Suppl. 1,73 (abstract). Complete manuscript
to be submitted for publication.
DISCUSSION
BEAUCHAMP: I wasn't quite clear on what the controller on that resistor looked
like.
M. ROTHENBERG: The analog electronic circuit used for simulating the combined-source
case in Figures 37-3, 37-5 and 37-6 will be described in more detail elsewhere
(Rothenberg, 1983). For all except the smallest areas and flows, a variable
resistance in the electronic circuit made the small-signal differential conductance
(the reciprocal of the resistance) proportional to the area squared divided
by the volume flow. Since the conductance or resistance then depends on the
volume flow rate, it is called "flow-dependent". This is the type
of equation you get when the energy loss causing the resistance is dominated
by kinetic energy losses. The flow-dependent losses are thought to dominate
at the larger glottal areas and resulting higher volume flow rates. But at small
areas and flows, the glottal conductance should, according to the theory resulting
from van den Berg's early model experiments, be approximately proportional to
Ag3 and not depend on
flow rate. However, to simplify the simulation I just made conductance proportional
to Ag and not Ag3
at small glottal areas. That was at areas below the equivalent of about 10 or
20% of the maximum glottal area in normal, non-breathy voicing. For the breathy
voicing Ag2/Ug
dominated throughout most or all of the waveform, since the glottal areas and
flow rates are greater than in normal voicing. Therefore including the flow-independent
term at small areas only affected the non-breathy voicing. But if you took out
the flow-independent resistance entirely and made the conductance proportional
to Ag2/Ug
for all areas and flows, the non-breathy waveforms changed, and what may be
significant in modifying van den Berg's theory, the waveforms changed in such
a way that you obtained a little better fit to the measured values of a and
Lt. But as I said in the paper, I don't know if that improvement
was accidental or not.
|
|
)
)
)
)
)