Monitoring Vocal Fold Abduction Through
Vocal Fold Contact Area
by Martin Rothenberg and James J. Mashie
Published in the Journal of Speech and Hearing Research, Volume 31, 338-351, September 1988
Summary: A number of commercial devices for measuring the transverse electrical conductance of the thyroid cartilage produce waveforms that can be useful for monitoring movements within the larynx during voice production, especially movements that are closely related to the time-variation of the contact between the vocal folds as they vibrate. This paper compares the various approaches that can be used to apply such a device, usually referred to as an electroglottograph, to the problem of monitoring the time-variation of vocal fold abduction and adduction during voiced speech. One method, in which a measure of relative vocal fold abduction is derived from the duty cycle of the linear-phase high pass filtered electroglottograph waveform, is developed in detail.
It is often desirable to monitor the degree of abduction or adduction of the vocal folds during voiced speech, both for steady voicing and during abductory or adductory movements. If the degree of abduction1 is not too large, this variable can theoretically be estimated from the variations in vocal fold contact area (VFCA) as the vocal folds vibrate, because abduction of the vocal folds will generally result in both less vocal fold contact and a shorter period of contact (Childers & Krishnamurthy, 1985; Fourcin & Abberton, 1971; Lecluse, Brocaar & Verschure, 1975; Wechsler, 1976). Subject to certain conditions discussed in more detail below, a Useful approximation to the variation in VFCA during the vocal fold vibratory cycle can be recorded noninvasively through the transverse electrical conductance (TEC) of the thyroid cartilage, using a device usually referred to as an electroglottograph (EGG). 2 In this paper, a method is described for estimating the degree of vocal fold abduction from the electroglottograph output.
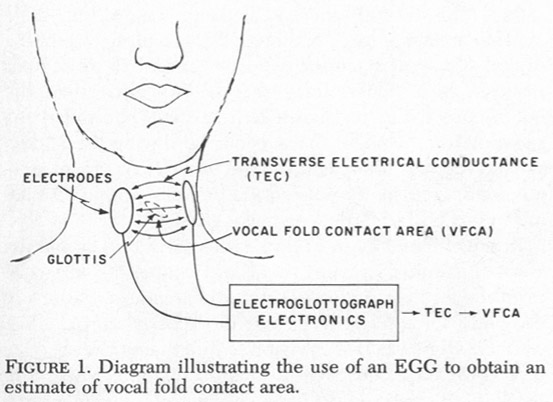
The term electroglottograph is generally accepted as the generic name for a class of devices in which vocal fold movements are monitored by means of a small, physiologically safe, electrical current passed through the neck at the level of the larynx, using two or more electrodes on the surface of the neck. In the more recent versions of this device, the current used is a-c (sinusoidal), at a frequency that is typically several megahertz. At frequencies this high, the current can capacitively bypass the less conductive, horny layer of the skin without the use of scraping procedures or a conductive paste, at least in the absence of facial hair. (In the presence of facial hair that is not well-shaven, a conductive paste may often improve performance.) As illustrated diagrammatically in Figure 1, in the typical two-electrode EGG (as was used in this study) the electrodes are placed so that the electrical current passes through the larynx roughly perpendicular to the glottis. The EGG circuitry uses this current to detect variations in the TEC of the larynx and nearby structures. As the vocal folds come into contact during their vibratory cycle, they cause a small increase in TEC. At maximum contact, this increase is usually an order of magnitude of 1% of the total conductance (Lecluse et al. 1975), though the variation could be considerably less than that percentage. The variation depends on the electrode configuration and placement, the position of the glottis within the neck, the structure of the thyroid cartilage, the amount of muscular, glandular and fatty tissue around the larynx, and the depth to which the electrodes are pressed into the neck when there is considerable subcutaneous fatty tissue. Though the variation in conductance is small, it can usually be detected using a well designed EGG.
If the glottis is well centered with respect to the electrodes, and the EGG signal relatively strong, it can be assumed that variations in TEC are approximately proportional to the change in vocal fold contact area. It should be kept in mind, however, that there has been little effort to quantify the error in this approximation, either theoretically or experimentally. Some possible sources of error that have not been adequately studied are pressure variations at the electrode interface, electrical capacitance between the separated vocal folds, errors in electrode placement, non-uniformity of the electric field near the larynx, effects of the mucous bridge between the vocal folds, and TEC variations due to pitch-synchronous vibrations of the false vocal folds. Thus, a TEC waveform obtained by means of an EGG can presently be considered only a rough estimate of VFCA. Nevertheless, because most of the various error sources can ultimately be quantified and possibly controlled, it seems reasonable to develop methods for measuring vocal fold movements that assume the EGG output to be an adequate representation of TEC and/or VFCA.
SLOWER VARIATIONS IN TEC AS A MEASURE OF VOCAL FOLD ABDUCTION
The TEC waveform can be considered the sum of a lower frequency component (below F0) and components harmonically related to the vocal fold vibratory period (at and above F0). Part of the low frequency component in the TEC waveform is the result of average vocal fold abduction, and theoretically may be of value for monitoring this aspect of vocal fold adjustment. Unfortunately, however, this low frequency component is usually confounded with low frequency noise that is difficult to separate from the desired component. This is because the time constant of an abductory or adductory adjustment in the larynx is of the same order of magnitude as the time constant for other extraneous events manifest in the EGG waveform. For example, lower frequency TEC variations having a time constant similar to an abductory movement can also result from artifacts such as movement of the electrodes, movements of other physiological structures in and near the neck, vertical movement of the larynx relative to the electrode position, and even heartbeat synchronous variations in the carotid artery. As a result, unless the electric field is very narrowly focused on the vocal folds, the broad-band TEC waveform contains artifacts that make extraction of laryngeal abduction information from the low frequency TEC waveform very difficult, even in the absence of the electrical noise that is added to a weak EGG signal.
Characteristics of the lower frequency component can be seen in the EGG waveform in Figure 2. This trace was obtained with an early Laryngograph unit (Fourcin & Abberton, 1971) that was modified to preserve the low frequency information in the TEC signal by increasing the high-pass time constants in the original automatic gain control circuit (feedback path from the output signal that controls the level of the current applied to the neck) and output amplifier coupling circuit so that the smallest time constant was at least 2 s. (Because the AGC system in this unit is nonlinear, the time constant can vary greatly with the signal level, and therefore cannot be specified accurately.) From the principles of linear system theory, a high-pass time constant of over 2 s is equivalent to a flat frequency response to frequencies as low as about 0.1 Hz and good phase response to frequencies as low as about 1.0 Hz. Because an increase in air flow is associated with a decrease in contact area, we prefer to display contact area in a negative direction. The result can be referred to as the inverted VFCA waveform.
The lower trace in Figure 2 is the simultaneous glottal air flow as obtained by inverse-filtering the output of a circumferentially-vented wire-screen pneumotachograph mask (Rothenberg, 1973). The two traces in the figure have been slightly adjusted in time by shifting the VFCA trace to the right, to compensate for the delays introduced by the electronic filtering and by the acoustic path from the glottis to the mask.
The waveforms shown in the figure were from the words “the hut,” extracted from the sentence “The tuba hovers over the hut,” as spoken by an adult male subject at a conversational volume. The increase in average air flow in Figure 2 clearly identifies the period of the abductory movement for the /h/. Note that although the air flow trace shows that the /h/ was voiced throughout, the EGG trace indicates that during two oscillations of the vocal folds near peak abduction no contact was made by the folds. The negative-going spike in the waveform indicating an increase in vocal fold contact disappears during those cycles. In addition, the spikes during the adjacent cycles are small and narrow (of short duration), indicating that a minimum of contact was present. Formally, the lack of a negative-going spike indicates only that there was no change in the degree of vocal fold contact. However, the presence of significant oscillatory movement of the vocal folds, as evidenced by the oscillations in air flow, allows the further interpretation that no contact occurred. It would be unlikely that no change in contact would occur if there was some significant area of the vocal folds in contact.
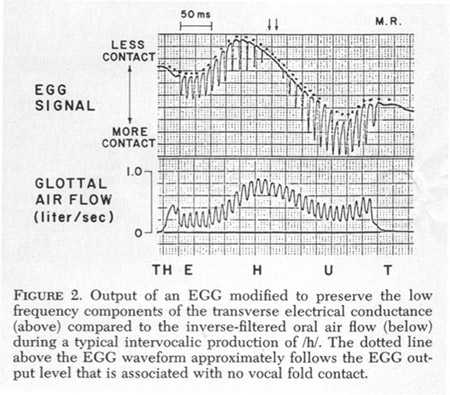
In the sample of Figure 2, the relative absence of vibration-synchronous waveform variation during the most-open (uppermost) portions of the waveform during the glottal cycles associated with the /h/ indicates that there was no significant vocal fold contact when the waveform was near its uppermost value for each cycle. It also indicates that there was very little contamination by F0-synchronous vibrations of other body surfaces that would be expected to appear as a low frequency component affecting the entire cycle to some degree. Thus the smooth contour of the upper excursions of the waveform in the vicinity of the /h/, as traced by the pattern of dots added by the authors, can be interpreted as roughly indicating an EGG level associated with no vocal fold contact. Because the dotted curve in the figure does not rise and fall with the increase and decrease of air flow for the /h/, it can be safely interpreted as containing low frequency noise in the EGG signal that is introduced by one or more of the above-mentioned factors.
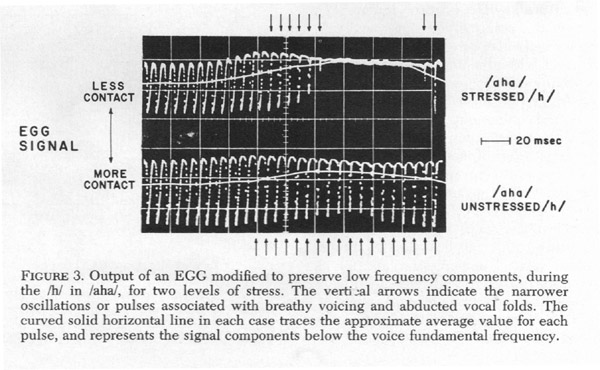
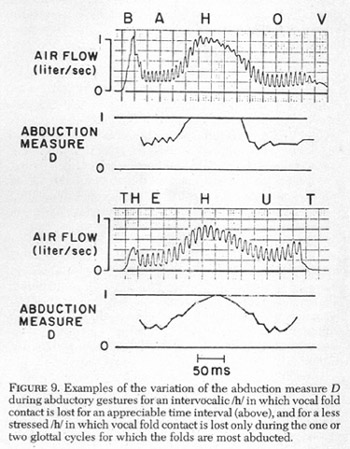
To support the contention that the dotted line in Figure 2 contains a significant low frequency noise component not directly related to abduction, the EGG trace during the /h/ in Figure 2 can be compared to the traces in Figure 3, taken with the same EGG. These were taken in a context chosen for minimal articulatory movement to reduce the low frequency artifacts, using the same speaker as in Figure 2. Although the sampling rate of the digital transient recorder used to capture these signals resulted in a dotted trace that is less clear than the continuous traces in Figure 2, it can still show that the same pattern of pulse shape occurred during the abductory-adductory movement for the /h/. The narrower negative-going pulses associated with a more abducted state are indicated by vertical arrows.
In the stressed /h/ in Figure 3, the vocal fold abduction was sufficient to prevent vocal fold contact for about 70 ms, though there were undoubtedly some oscillations of me vocal folds for at least part of that period. (As illustrated in Figure 2, it is common to find that in the absence of a vocal tract constriction to limit air flow, vocal fold oscillations continue during an abductory movement to a degree of abduction well beyond that which causes no vocal fold contact.) In the unstressed /h/ below, a strongly abducted vocal fold adjustment was never attained, as evidenced by the presence of a significant amount of vocal fold closure during each glottal cycle. The duration of the total cyclic (voiced to breathy-voiced to voiced) abductory gesture in the unstressed case, about 110 ms, compares favorably with the time required for a maximally fast cyclic gesture, as obtained previously from air flow records (Rothenberg, 1972).
The solid curved lines drawn in Figure 3 show the approximate time course of the low frequency (short-time averaged) component of the waveform. These lines trace a rough estimate of the average value of each glottal pulse and illustrate our point that if the low frequency noise due to articulatory movements and other factors is not present, the low frequency component of the EGG trace tends to vary inversely with vocal fold contact area and could theoretically be used to indicate relative vocal fold abduction. Because estimates of average value were made from the height and waveshape of the EGG pulse during each glottal cycle, the resulting trace would approximate the output of an ideal (no phase distortion or time delay) low pass filter with a cutoff frequency just below the voice fundamental frequency.
The interpretations made of the EGG signals in Figures 2 and 3 agree well with what would be expected from a device that measured vocal fold contact area during an abductory movement but had an output contaminated by TEC variations due to nearby tissue movements. The waveform features described have been noted consistently in waveforms recorded in our laboratory from other speakers and with other EGG units. To illustrate the degree of variation to be expected, we have assembled in Figure 4 a number of EGG traces recorded from persons randomly chosen from those in the laboratory on a given day, using a second EGG that was constructed in our laboratory. This unit employed the same electrode configuration as the Laryngograph unit used for Figures 2 and 3, but different electronic circuitry. As in Figures 2 and 3, the time constants used for Figure 4 were made long enough to retain most of the waveform variation over one or two syllables. All subjects were native English-speaking adults.
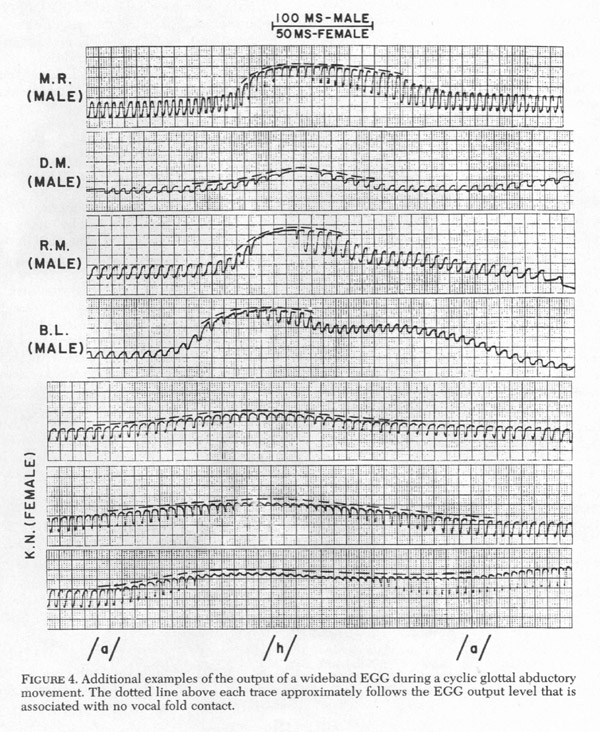
The traces in Figure 4 were from productions of the isolated bisyllable /aha/ in which the consonant was rather brief and only slightly aspirated, as would be common in English if the following vowel was not stressed. For one speaker (KN), examples are presented showing three degrees of abduction, increasing from top to bottom. The speaker in the top trace was the same as in Figures 2 and 3. As in Figure 3, in the vicinity of the abductory gesture the level representing no vocal fold contact is traced by a (dashed) line drawn in above the EGG waveform wherever this level is clearly delineated by a relatively flat uppermost segment that is continuous with those in neighboring cycles.
Note, however, that for the female speaker the uppermost segments are not quite flat, even when there is no negative-going spike to indicate vocal fold closure, as in her strongest abductory movement in the lowermost trace. A likely explanation is that these oscillations were caused by pitch-synchronous TEC variations due to factors other than vocal fold contact area, as mentioned above (for example, pressure variations at the skin-electrode interface). This possible noise or distortion component is most visible in KN’s waveforms because the contact area EGG variations were weakest for this subject. The resulting small, almost sinusoidal component appears to be present throughout the waveforms, but is most noticeable when the negative-going spikes are small or not present. (The center trace of the three for KN was interesting in that the vocal folds apparently came into contact during each glottal cycle, but barely touched during the most abducted 5 or 6 glottal cycles.) The waveforms from male speaker BL also tended to show such variations, probably because his signal was the weakest among the male subjects (it required the most amplification).
Also notable in Figure 4 is the asymmetry in the abductory movement for three of the male subjects (MR, RM, and BL). The more rapid abductory phase could have been caused by either a strong, sudden contraction of the abductory musculature or an aerodynamically-induced delay in the abduction as the Bernoulli forces tended to oppose the onset of the abductory muscle tension.
To illustrate why we found the low frequency component of the EGG signal that correlates with vocal fold abduction to be of only marginal utility in identifying abductory gestures, a wide-band EGG signal from a series of alternating voiced and unvoiced bilabial consonants is shown in Figure 5, as photographed from the face of a charge-storage oscilloscope (Tektronix model 564). The consonants and the vowel context were chosen for a minimal increase over the /aha/ example in the articulatory-generated low frequency noise that tends to obscure the low frequency component of the VFCA waveform. The time scale is such that the individual waveform pulses resulting from vocal fold contact cannot be discriminated, and the presence of such pulses is indicated by a white area outlining the pulse extremities.
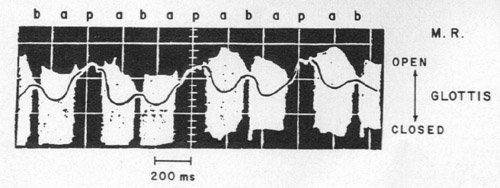
Figure 5.
Output of an EGG modified to preserve the low frequency components,
during a sequence of alternating voiced and unvoiced intervocalic bilabial
consonants. The undulating horizontal line is drawn in to indicate the time
course of the low frequency components of the waveform, that is, those
components below the voice fundamental frequency.
The trace in Figure 5 was chosen as having the least low frequency noise (and therefore a probable close-to optimal electrode position) in a sequence of such trials, and was taken with a (adult male) subject who produced a strong EGG signal. The implication is that the low frequency information with a more randomly chosen subject, electrode position, or linguistic context would be expected to be no more clear than in Figure 5 with the type of EGG unit used, and this was corroborated with a number of other subjects. The solid curved line drawn in Figure 5 is the approximate time course of the time averaged or low frequency component of the waveform, which follows the average value for each glottal pulse when such pulses are present, The average value during these “pulsed” intervals was sketched from a familiarity with how the average value fell between the extremes for this particular subject. This estimate of the average value is, again, not meant to be mathematically exact, but only accurate enough to illustrate our point that some increase in the short-time-averaged, or low frequency, inverted VFCA waveform tends to occur during both a voiced and an unvoiced occlusive. Although the unvoiced peaks (for /p/) tend to be greater than the voiced peaks (for /b/), they are not reliably enough different for most applications, even in this optimum sample (strong EGG signal, constant laryngeal position, optimal electrode placement, and minimal articulatory interference).
The EGG unit we used for the tests reported here, other than the comparison in Figure 4, is a rather standard model that is not considered significantly poorer in performance than those offered by other manufacturers. Thus, it appears that unless a much improved version of the EGG with significantly less low frequency artifacts is developed, it would generally be better to ignore the low frequency component of the wide-band EGG signal when attempting to monitor vocal fold abduction during speech-like utterances, and instead look for information in the EGG waveform at and above the voice fundamental frequency, since such higher frequency components are more resistant to corruption by random and articulatory noise. This is not to say, however, that the low frequency information in the waveform of a currently available EGG unit could not be used in exploratory work or on a suggestive or advisory basis, providing the unit was designed or modified to preserve the low frequency information over a duration of at least one syllable.
USING THE HIGH-PASSED EGG WAVEFORM TO MONITOR VOCAL FOLD ABDUCTION
Waveform Characteristics During Vocal Fold Abduction
Now let us see how the high-passed VFCA waveform varies as the vocal folds are abducted. Figure 6 shows an EGG waveform for an intervocalic /h/ by an adult male speaker after the low frequency variations have been removed by an eight-pole, Bessel-derived, matched-delay-subtractive (MDS) linear-phase high pass filter with a -3-dB frequency of about 50 Hz (see Appendix). This filter effectively removes the low frequency energy, so that the average value for each of the EGG glottal pulses is close to the zero level. Subject to the uncertainties described above, a strong EGG waveform with low frequencies removed by linear-phase filtering will be considered here as an adequate representation of the relative variation of vocal fold contact during each glottal cycle, and referred to using the VFCA notation.3
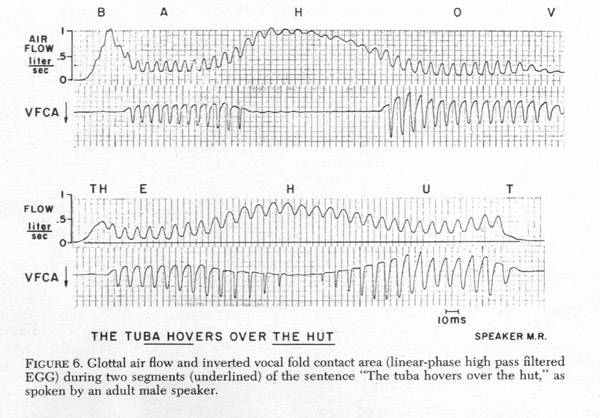
In the top waveform of each pair in Figure 6, the oral air flow, as recorded from the pneumotachograph mask, was coarsely inverse-filtered to remove most of the formant oscillations. Differences between the traces in the time delays caused by the glottis-to-mouth distance and the electronic processing were equalized in the figure by an appropriate physical offset of the VFCA record with respect to the flow record. (The VFCA waveform was shifted right by 4 ms.) The low frequency oral air flow components that are caused by movements of the supraglottal articulators, and do not reflect glottal flow (Rothenberg, 1973), are relatively small in these sound sequences compared to the flow increase for the /h/, and can be neglected in the following discussion.
It can be seen in the air flow waveform in Figure 6 that the average air flow generally increases as the vocal folds are abducted. Also, the variations or oscillations in air flow at the fundamental frequency, that is, the variations that are synchronous with vocal fold oscillations, get progressively smaller, and finally almost die out altogether in the longer, more stressed /h/ in “hovers.” During adduction, the reverse process occurs.
Looking at the inverted VFCA waveform, we see that as the folds are abducted, the duty cycle 4 of the negative going pulse caused by vocal fold contact changes, until there are only narrow negative-going pulses representing the progressively briefer closed-phase periods. The reverse process occurs during adduction. The obvious interpretation is that vocal fold contact is maintained for progressively less of the glottal cycle as the vocal folds are abducted. This interpretation can be supported by examining an enlarged version of the traces in Figure 6, from which it can be seen that these VFCA pulses closely correspond in timing and duration to the evidence of a closed phase in the air flow waveform, namely, the existence of a small, relatively flattened region near the lowest point of each flow pulse (see also Rothenberg, 1985). When this flattened region disappears from the flow signal, the pulses invariably disappear from the VFCA waveform.
Though in this study we have used the glottal air flow waveform as a reference for determining the presence and timing of a closed phase, the same conclusions can be arrived at using high speed motion pictures (for example, Childers, Moore, Naik, Larar, & Krishnamurthy, 1982) or glottal transillumination (the “photoglottograph”) (for example Fant, Ondrackova, Lindqvist & Sonesson, 1966, or Rothenberg, 1985).
The VFCA waveforms in Figure 6 and Figure 3 also demonstrate that an abductory gesture can sometimes result in a change in the amplitude of the VFCA waveform. Near the beginning of an abductory movement, the peak-to-peak amplitude of the VFCA waveform is often somewhat greater than during the neighboring vowel. This is apparently caused by a cycle-to-cycle decrease in the minimum contact area attained when the folds are open, which causes a rise in the level of the flat region at the top of the signal. During this early part of the abductory gesture, the decrease in the level of the minimum contact area when the folds are open can apparently be greater than the decrease in maximum contact area when the folds are closed, causing a net increase in peak-to-peak waveform amplitude. After this initial increase in peak-to-peak amplitude during the beginning of an abductory movement, the VFCA waveform gets progressively smaller as the maximum contact area during the closed period decreases. The same phenomenon can occur near the end of an adductory movement.
It should be mentioned here that in Figure 6 the relative levels of either the tops or the bottoms of EGG oscillations that are more than 2 or 3 pulses apart are not accurate reflections of the actual contact areas. For intervals longer than about 20 to 30 ms, the high-pass filtering that was used to remove the low frequency noise and movement artifacts from the waveform will equalize the average value, and thus change the vertical position of the VFCA pulses. However, the relative levels between pulses are better preserved in the example in Figure 3, because less high-pass filtering was used.
So we have at least two factors that we can use to derive the degree of abduction from the high frequency or vibration-synchronous component of the inverse VFCA waveform-the duty cycle of the negative-going pulse and the pulse height. Of these, we feel that the duty cycle is the most reliable feature, since its variation is relatively larger, and is probably less affected by changes in subglottal or supraglottal pressure.
Some EGG Correlates of Duty Cycle
To obtain a measure of vocal fold abduction from the duty cycle of the VFCA waveform, two problems must be solved. First, we must decide on how best to measure the VFCA duty cycle, and, second, we must determine how best to obtain a measure of abduction from the measure of duty cycle. In Figure 7, the air flow waveform at the mouth, obtained from a circumferentially-vented pneumotachograph mask, has been accurately inverse-filtered to obtain glottal air flow and set in proper time alignment with a VFCA waveform recorded simultaneously. The EGG used both in this figure and Figures 9 and 11 was the same Laryngograph unit used for Figures 1 through 3, but with the high pass time constants increased only to be roughly 50 to 100 ms. Time constants in this range will preserve almost all the signal variations due to vocal fold vibratory action, while rejecting much of the low frequency components discussed above.
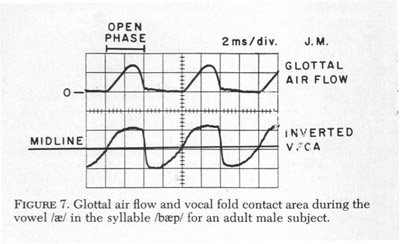
In Figure 7, we have defined the “open phase,” B, of the glottal cycle from the air flow waveform as the period from the first increase in air flow associated with the onset of the glottal opening phase to the termination of the decrease in air flow at the end of the glottal closing phase. 5 The relatively flat portion of the air flow waveform between successive open phases defines an interval, C, during which an appreciable part of the vocal folds is in contact. It can be called the “closed phase,” although, as in this case, the existence of some residual air flow during that interval often shows that not all of the glottis is closed. The sum of the durations of the open phase B and closed phase C is the glottal period, notated T, and the relative lengths of the open and closed phases (B/T and C/T) will be referred to as the open quotient QB and closed or closure quotient Qc, respectively. Either the open or closed quotients can be used to describe the glottal duty cycle. The “midline” drawn through the VFCA trace in Figure 7 is discussed below.
Useful estimates of the open and closed phases of the glottal cycle can often be obtained from the high-passed VFCA waveform. For example, in a method proposed by Childers, et al. (1982), the VFCA waveform is differentiated to find the points of greatest rate-of-change. Theoretically, these points would be expected to occur near the instants at which the vocal folds come into and out of contact, since the rate-of-change (time-derivative) of the contact between the folds is usually relatively large near these instants. Thus the positive and negative peaks of the differentiated VFCA waveform would be expected to approximately define the duration of the glottal pulse. Childers, et al. report that this method works well with a strong EGG signal. However, with a weak signal the process of differentiation makes the method susceptible to higher frequency noise components, which can create spurious peaks in the differentiated waveform. This is especially true when attempting to locate the onset of the glottal air flow pulse, since the derivative of even a noise-free VFCA waveform often has no clear instant of peak magnitude during the glottal opening phase.
It should also be noted that although the onset of the air flow pulse is reasonably close to a negative peak in the differentiated VFCA waveform, the flow onset is more accurately identified with a negative peak in the VFCA second derivative, which would represent the instant of the greatest rate-of-change in the rate of contact. Unfortunately, the second time-derivative is even noisier than the first derivative.
Criterion-Level Methods for Estimating Duty Cycle
In the present research, a more noise resistant measure of the duration of the glottal pulse is obtained from the instants at which the undifferentiated EGG waveform crosses a predetermined criterion level, after the waveform has been high pass filtered to remove the low frequency noise and movement artifacts.
The criterion-level method is illustrated by the horizontal line drawn through the inverted VFCA trace in Figure 7 at an amplitude approximately half-way between the positive and negative peaks. The two segments of the VFCA waveform at this amplitude, that is, the segments above and below the line, have durations very close to those of the glottal air flow pulse, or open phase, and the closed phase. In fact, in this example the VFCA midline criterion yields estimates of the open phase and closed phase that are essentially indistinguishable from those obtained from a just-noticeable flow increase criterion based on the first noticeable increase in air flow that can be associated with the glottal air flow pulse. From a model for the various phases of the VFCA waveform in normal voicing (Childers & Larar, 1984; Rothenberg, 1981a; Titze, 1984) it can be shown that we can expect at least a rough correspondence between these VFCA and flow measures for a wide range of waveforms. This correspondence is also illustrated in the records shown in Figure 6.
Though possibly not as accurate in separating the open and closed phases as the differentiation method when the EGG signal is strong and noise-free, the criterion-level method can be used with EGG signals in which the signal-to-noise ratio is not much greater than unity. Also, as explained below, the criterion-level method may be better for detecting adductory gestures, since the criterion level can be selected to detect certain VFCA waveshape changes that often occur with adducted voicing. The criterion-level method does, however, require a certain degree of waveform fidelity near the fundamental frequency, and thus any high-pass filtering (including automatic gain control action) within a factor of about five of the fundamental frequency should be of the linear phase type (Appendix) to retain the proper relative phase of the fundamental component.
In the criterion-level (CL) method, the CL can be reasonably determined in a number of ways, with the most apparent methods involving a comparison of either the area (time-integral) or the amplitude of the waveform above and below a proposed CL. Selecting a CL to equalize the areas above and below the CL is equivalent to making the CL the average value of the waveform during each cycle, or, in functional terms, selecting as the CL the zero level of the high-pass filtered waveform. Selecting a CL from the maximum and minimum amplitudes of the waveform during the glottal cycle will be referred to here as using a %-level criterion.
The major advantage of the average-value-level criterion is that it is slightly easier to implement than the %-level criterion. The primary disadvantage is that in the presence of low frequency artifacts or a rapidly changing waveform, strong linear-phase high pass filtering is required (or some digital equivalent if digital processing is used) in order to keep the zero level for each cycle at the average value for the cycle. The %-level criterion, by contrast, requires only moderately effective linear-phase high pass filtering, because the process of using the preceding and succeeding extreme values for each criterion determination automatically compensates for any remnant low frequency variations in the VFCA waveform. In the analysis and examples described in this paper, we have somewhat arbitrarily employed a %-level criterion.
The criterion level illustrated in Figure 7 is midway between positive and negative extremes of the VFCA waveform. A CL so determined will be referred to as a 50%-level criterion. In more recent work we have been using a level that is closer to most-open-glottis (or least vocal fold contact) extreme, 35% from the peak value. Using a 35%-level criterion instead of the 50% criterion used in Figure 7 does not change very much the instants at which the waveform crosses the criterion level during normal and breathy voice, since the VFCA waveform changes rapidly between these levels. However, during voicing produced with a greater-than-average degree of vocal fold adduction, as near as a glottal stop, the VFCA waveform often changes shape in such a way that the 35% criterion will result in a greater change in duty cycle (a shorter estimate of glottal pulse width) than the 50% criterion. Thus the 35% criterion is advantageous when vocal adduction (from normal) is to be detected. This factor is discussed in more detail below. (A consideration of the waveforms involved and their average value leads to the conclusion that an average-value criterion will result in duty cycle estimates that are similar to those yielded by a 50%-level criterion during either normal or adducted voice, but similar to estimates yielded by a 35%-level criterion during breathy voice.)
Determining Relative Abduction From the Duty Cycle
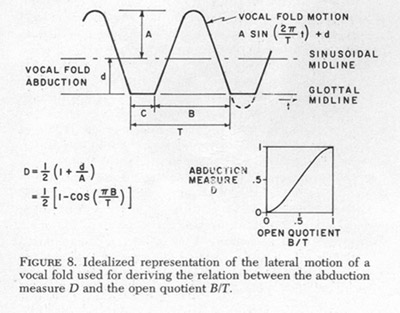
But once we have decided on how best to extract a measure of duty cycle from the VFCA waveform, how can a measure of abduction best be obtained from the duty cycle measure? To illustrate the procedure we have developed for this purpose, Figure 8 shows the lateral motion in time of the medial margin of a hypothetical vocal fold. In this simplified model of vocal fold motion, the vocal folds are assumed to oscillate laterally with no vertical phase differences in vocal fold motion, in a smooth sinusoidal movement that is interrupted at the glottal midline as the two vocal folds collide. The displacement from the midline is thus described by the expression A sin (2pt/T) + d, where A is the amplitude of the sinusoidal trajectory, T is the glottal period, and the distance d from the glottal centerline to the center of sinusoidal vocal fold motion trajectory is assumed to characterize the degree of abduction. The variable B in the figure is the duration of the period during which there is no vocal fold contact, and C is the duration of the period of glottal closure.
To express d as a function of the open quotient B/T, we can note that the expression for displacement given must be equal to zero when the time t is equal to B/2 + T/4 (the time at the onset of the first closure period after t = 0). Solving for d, we get:
| d = –A sin [2p ((B/2) + (T/4)) / T] | ||
| d = –A sin [(p B/T) + (p/2)] | (1) |
|
| d = –A cos (p B/T) |
Because d cannot be easily estimated noninvasively, we define a more convenient measure of vocal fold abduction by normalizing d with respect to A, the amplitude of the vocal fold oscillations. In addition, we choose to modify the resulting measure of abduction so as to limit it to a range of 0 to 1. These ends are accomplished by defining as our final duty-cycle-derived abduction measure the variable D in equation 2.
| D = [�] [1 + (d/A)] | (2) |
Substituting equation 1 in equation 2, we obtain:
| D = [�] [1 – cos(p B/T)] | (3) |
As illustrated in Figure 8, equation 3 can be defined for any value of open quotient, that is, for 0 < B/T < 1. However, this expression would be expected to hold most closely for large values of B, that is, for abducted or breathy voicing, for which the extent and duration of vocal fold contact is relatively small, because in this case the energy loss due to collision forces is low, and the effect on the projected glottal area waveform of vertical phase differences in vocal fold motion should also be small. An open quotient significantly less than about one-half, yielding a negative value of D, would imply a degree of adduction for which the model in Figure 8 (of freely oscillating vocal folds that have an overall motion relatively unaffected by the vocal fold contact and a projected glottal area unaffected by vertical phase differences) would not be expected to hold. Optimizing D with highly adducted voicing is considered separately below.
Figure 9 illustrates an early attempt to derive the abductory measure D from the VFCA duty cycle, in the two productions of /h/ in the same recording of the sentence “The tuba hovers over the hut” that was used for Figures 2 and 6. The variation in the abductory measure in Figure 9 can be compared to the low frequency variation in the air flow waveform shown above it, that is, the rise and fall of average air flow that corresponds to the cyclic (returning to normal voice position) abductory gesture for the /h/. The VFCA duty cycle was estimated from the instants at which the waveform crossed the 50% criterion level, as hand measured on an expanded trace. The measure D was plotted by hand for each glottal cycle, and the points connected by line segments. It can be seen that the general form of the air flow increase during the abductory phase at the onset of each /h/ is retained by our measure; however, the adductory phase of the measure appears delayed when compared with the corresponding decrease in air flow. This is presumably caused by the vocal fold oscillations being smaller, for a given degree of abduction, when the folds are adducting than when they are abducting, with the smaller oscillations during adduction the result of the inertia involved in the build-up of oscillatory energy. The reduced amplitude of the vocal fold oscillations results in a shorter period of vocal fold contact.
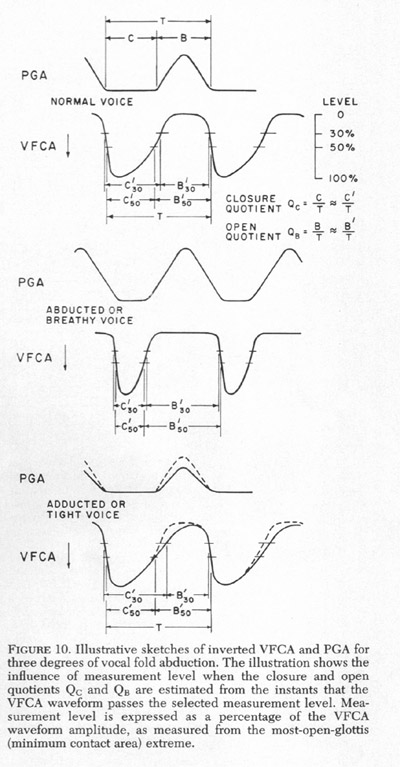
Because the relationship between the glottal open and closed phases and the waveform of vocal fold contact area can be more complex during highly adducted voicing than is indicated in the example of Figure 7, the procedure for estimating the open and closed phases from the EGG signal may require some extension and modification for that case. The pertinent relations are sketched diagrammatically in Figure 10 for some typical idealized waveshapes representing three degrees of abduction. The duty cycle is estimated from the instants at which the VFCA waveform crosses the selected criterion level. Both the 30% and 50% criterion levels are illustrated in the figure, with C�K and B�K the resulting estimates of C and B using the level K. Note that for normal and breathy voice, because of the steepness of their VFCA waveforms in the center regions, the exact level at which the crossings are measured has only a small effect on the resulting estimates of C and B.
Sketched in Figure 10 is a typical VFCA waveform for voicing in which the vocal folds are more adducted than in normal voice (“tight” voice). The waveforms for normal voice are shown dashed for comparison. Though there is much more variation between individuals than is the case in normal or breathy voice, we have noted that this tight voice waveform tends to become more triangular, presumably because the phase differences between the contact patterns at various locations on the vocal folds become increasingly significant and cause the disappearance of a clear open-glottis period. As can be seen from the sketch in Figure 10, the closed and open period estimates, C� and B�, when taken at the 50% level, may not vary much between normal and tight voice. C� would increase about 5% and B� would decrease about 5%. However, it can be seen that a much clearer distinction arises when the estimates are taken at, say, the 30% level. For the waveforms in the sketch, C� and B� would differ by more than 15% between the “normal” and “adducted” cases. In other words, by using C�30 and B�30 instead of C�50 and B�50 as estimates of C and B, a clearer distinction can be made between a normal and a tight voice, while not significantly influencing the differentiation between a normal and a breathy voice.
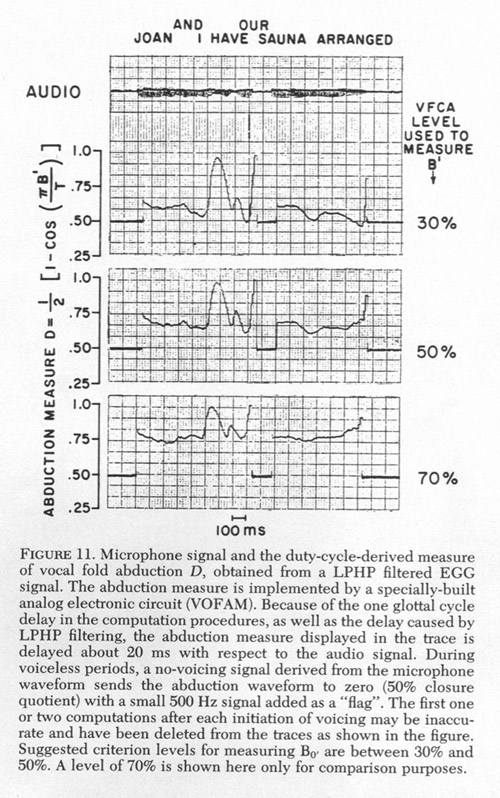
To illustrate these principles with an actual example, Figure 11 shows the extracted measure of vocal fold abduction during the sentence “Joan and I have our sauna arranged.” This sentence was produced by an adult male native speaker of English. If there is some stress on “arranged,” the junction between “sauna” and “arranged” will often be produced with an adduction of vocal folds to signal the word boundary, as in this production. The measure of abduction 6 shown here is the normalized cosine transform of the open quotient in equation 3 above, with the open quotient estimated from the VFCA waveform using a 30%, 50%, and 70% criterion level, as measured from the most open (least contact) extreme. A specially-constructed analog electronic circuit, termed by us the Vocal Fold Abduction Monitor, or VOFAM, made this measure of abduction automatically at the end of each glottal period and held it until the next glottal period, to produce a trace with small “step” changes. It can been seen that in this case a criterion level of 30% produced a clearer indication of vocal fold adduction at the “sauna” – “arranged” word boundary than did a level of 50% or 70%. As predicted from the sketches of Figure 10, the use of a 30% level does not significantly change the representation of the abductory gesture for the /h/ of the “have” or the /s/ of “sauna,” though it does tend to reduce the value of the measure during the nominal “neutral” vowel segments (as during the /on/ of “Joan,” the /on/ of “sauna” or the /ren/ of “arranged”) from an average of about 0.68 to an average of about 0.58. The variation in D at the end of the sentence is related to the reduction in subglottal pressure and voice fundamental frequency at the end of a breath-group, as well as any terminal abductory behavior, and is not discussed further in this paper. Other examples of the use of the VOFAM unit for monitoring abductory movements can be found in Conture, Rothenberg, and Molitor (1986).
VFCA MEASURE OF ABDUCTION DURING CONSONANTS AND CONSONANT TRANSITIONS
At least two of the EGG-derived measures discussed here — VFCA duty cycle and pulse height — are easy to implement and automate, given a reasonably strong signal from the EGG. The degree to which they are also useful in unvoiced sounds other than /h/, such as fricatives and stops, is not yet fully clear. Their usefulness depends on how the VFCA waveform changes when a supraglottal constriction causes the supraglottal pressure to increase. What might be expected from a VOFAM-type abduction monitor can be seen in the termination of the duty-cycle-derived abduction traces in Figure 9 above. In the upper sample, the second vowel is followed by a voiced consonant /v/, and the value of D rises only slightly. However, an unvoiced /t/ follows the second vowel in the lower sample, and the D trace swings sharply upward to indicate the onset of an abductory movement.
In interpreting the consonant transitions in Figure 9 it should be noted that the high air flow at the onset of voicing in each segment, that is, at the release of the /b/ and at the termination of an apparently complete articulatory constriction for the /O/, may be largely due to the release of supraglottal pressure or to a vocal fold oscillatory behavior at the initiation of voicing that differs from the steady-state behavior at the same degree of abduction and cannot be taken to indicate the degree of vocal fold abduction. To interpret inverse filtered oral air flow immediately after an articulatory closure one must at least subtract the flow components caused by supraglottal air compression and wall compliance, or, preferably, prevent the build-up of intraoral pressure by bypassing the closure with some type of appliance (Rothenberg, 1968). In all cases, an accurate assessment of the pattern of average glottal air flow would require a subtraction of the air displaced by the purposeful movements of the articulators.
CONCLUSIONS
It appears that, given a reasonably strong signal, the output of an EGG can be used for monitoring the degree of abduction or adduction of the vocal folds, at least during voiced speech in which there is no strong supraglottal constriction. The method proposed here, in which a measure of abduction is derived from the duty cycle of the linear-phase, high pass filtered EGG waveform, using a criterion-level to define the duty cycle, is at least a reasonable approach considering the alternatives available.
Duty-cycle-derived methods will naturally depend on the definition of duty cycle. Though we have argued here for a definition related to a specific measure of the duty cycle of either glottal air flow or projected glottal area, this need not be the case. If the goal is to be a useful measure of abduction and adduction, a very close correspondence with flow or area measures may not be optimum. We have shown that this is especially true for very adducted voice, and further research on the nature of the EGG waveform with adducted voice may result in some modification of the scheme suggested in this paper.
When there is some considerable build-up of supraglottal pressure caused by a supraglottal articulatory constriction, as during some voiced consonants or during a vocalic transition to or from an unvoiced obstruent, the measure proposed here may still be useful, but care must be exercised in its application because of the changes in the EGG waveform resulting from the rise in supraglottal pressure generated by the supraglottal constriction.
ACKNOWLEDGMENTS
Since the original development of the basic concepts presented in this paper (Rothenberg & Mahshie, 1979) the authors have had the pleasure of working with Edward Conture, Edward Cudahy and Richard Molitor (at Syracuse University) and Akira Hasegawa (at Gallaudet University) on various applications of the abduction measure in studying normal and pathological speech. Many of their comments and suggestions have undoubtedly found their way into this final version. Richard Molitor has also provided a thorough editing of the manuscript. We are also indebted to Nelson Correa for the design and construction of the VOFAM implementation of the abduction measure. The research was supported by research grants from the National Institutes of Health.
FOOTNOTES
1. When used in a general sense, as is the case in the footnote sentence, the term “abduction” will be used to include both abduction and adduction from the normal voice position, in order to avoid the cumbersome “ab-adduction” or “abduction/adduction” terminology. Thus, when used in this way, adduction can be thought of as a “negative” abduction.
2. Although there may be no clearly optimal notation, we prefer to refer to the EGG as measuring the electrical conductance of the vocal fold contact, instead of the inverse quantity, electric resistance, because an increase in contact causes an increase in conductance. It should also be noted that in practice, a specific EGG unit may actually be measuring the transverse electrical admittance or its inverse, impedance, at a specific electrical frequency, with the conductance being the dissipative component of the admittance. Whether the conductance or the magnitude of the total admittance is a better representation of the contact area has not been determined, but differences are likely to be slight. A theoretical analysis would probably indicate conductance to be the better choice since the admittance eludes the electrical capacitance between the vocal folds.
3. When the EGG waveforms are to be interpreted as a representation of vocal fold contact area, they are labeled as such, much like any other measurement of a physical or statistical variable (as when a “microphone output” is labeled “radiated sound pressure”). When an EGG waveform has been shown corrupted by obvious low frequency artifacts or other distortion, it has been labeled only as the EGG signal. Thus the label used represents both the interpretation that we would like the reader to make and our degree of confidence that the waveform is an adequate representation of the relative vocal fold contact area.
4. The term “duty cycle” is usually applied to on-off processes, and signifies the ratio of the total accumulated on-time to the total time, or, if the process is periodic, the ratio of on-time in a period to the duration of the entire period. Thus the duty cycle for air flow would be the duration of the open phase divided by the glottal period. However, since the glottal phase that constitutes on-time for a VFCA waveform is ambiguous, we prefer the terms “open quotient” for “glottal open phase divided by period” and “closed quotient” for “glottal closed phase divided by period”. The term duty cycle is thus reserved for instances in which we refer to the general concept of relative open or closed time, with both open quotient and closed quotient being specific measures of the duty cycle.
5. Since the flow onset is often gradual, at least partially because of flow-inertance effects (Rothenberg, 1981b), the instant of onset can be difficult to specify precisely, and so for practical purposes a non-zero criterion level of, say 10% or 20% of the peak flow variation might be a better choice for specifying the extent of the glottal pulse, but we will not consider this question further in this paper.
6. To be logically consistent, estimates of B implemented using a specific criterion level should be notated as such, as, for example, D30 for a measure obtained from B30. To simplify the presentation, this notation has not been implemented in this paper.
REFERENCES
CHILDERS, D., & KRISHNAMURTRY, A. (1985) A critical review of electroglottography. CRC Critical Reviews in Biomedical Engineering, 12, 131-161.
CHILDERS, D., & LARAR, J. (1984). Electroglottography for laryngeal function assessment and other applications. IEEE Transactions on Biomedical Engineering, 12, 807-816.
CHILDERS, D., MOORE, G., NAIK, J., LARAR, J., & KRISHNAMURTHY, A. (June 1982). Assessment of laryngeal function by simultaneous synchronized measurement of speech electroglottography and ultra-high speedfilm. Paper presented at the Twelfth Symposium on Care of the Professional Voice, The Julliard School, New York City.
CONTURE, E. G., ROTHENBERG, M., & MOLITOR, R. D. (1986). Electroglottographic observations of young stutterers’ fluency. Journal of Speech and Hearing Research, 29, 384-393.
FANT, G., ONDRACKOVA, J., LINDQVIST, J., & SONESSON, B. (1966). Electrical glottography. Quarterly Progress and Status Report 4/1966, Speech Transmission Laboratory, Royal Institute of Technology, Stockholm, 15-25.
FOURCIN, A., & ABBERTON, E. (1971). First application of a new laryngograph. Medical Biology Illustrated, 21, 172-183.
LECLUSE, F., BROCAAR, M., & VERSCHURE, J. (1975). The electroglottography and its relation to glottal activity. Folia Phoniatrica, 27, 215-224.
NG, T., & ROTHENBERG, M. (1982). A matched delay approach to subtractive linear phase high-pass filtering. IEEE Transactions on Circuits and Systems, CAS-29, No. 8, 584-587.
ROTHENBERG, M. (1968). The breath stream dynamics of simple-released-plosive production. Bibliotheca Phonetica, Vol. 6.
ROTHENBERG, M. (1972). The glottal volume velocity waveform during loose and tight glottal adjustments. Proceedings of the VII International Congress of phonetic Sciences, 380-388.
ROTHENBERG, M. (1973). A new inverse-filtering technique for deriving the glottal air flow waveform during voicing. Journal of the Acoustical Society of America, 53, 1632-1654.
ROTHENBERG, M. (1981a). Some relations between glottal air flow and vocal fold contact area. In C. Ludlow & M. O’Connell (Eds.), Proceedings of the Conference on the Assessment of Vocal Pathology, ASHA Reports, 11, 88-96.
ROTHENBERG, M. (1981b). Acoustic interaction between the glottal source and the vocal tract. In K. Stevens & M. Hirano (Eds.), Vocal fold physiology (pp. 305-328). Tokyo: University of Tokyo Press.
ROTHENBERG, M. (1985). Source-tract interaction in breathy voice. In I. Titze & R. Scherer (Eds.), Vocal fold physiology: Biomechanics, acoustics and phonatory control (pp. 465-481). Denver: Denver Center for the Performing Arts.
ROTHENBERG, M., & MAHSHIE, J. (1979). Monitoring vocal fold abduction through vocal fold contact area. Paper presented at the meeting of the American Speech-Language and Hearing Association, Atlanta, GA.
TITZE, I. (1984). Parameterization of the glottal area, glottal flow, and vocal fold contact area. Journal of the Acoustical Society of America, 75, 570-580.
WECHSLER, E. (1976). A laryngographic study of voice disorders. British journal of Disorders of Communication, 12, 9-22.
Received January 13, 1986
Accepted October 5, 1987
LINEAR-PHASE HIGH PASS FILTERS
A high pass filter can be used to remove or attenuate Fourier components of a given waveform that are below the frequency range of interest. In doing this, it is necessary for the filter to delay at least those components of the input waveform that are near or below the filter “cutoff” frequency. To avoid the waveform distortion that would be caused by delaying only the lower frequency components of the output waveform, a “constant-delay” high pass filter retains the correct time alignment of all significant Fourier components by delaying all components by the same period of time. Because delaying all components by the same period T means delaying each component by a phase angle Q = 2pfT radians, which is proportional to the frequency f of the component, this type of minimally distorting filter is often referred to as a “linear-phase” filter. Since linear-phase high pass filters cannot be conveniently constructed from conventional analog circuit elements (Ng & Rothenberg, 1982), they are not widely used at present. We will therefore illustrate the operation of such a filter using a record from this paper.
The effect of linear-phase high pass (LPHP) filtering on a VFCA waveform is illustrated in Figure A-1, obtained from the words “the hut” as spoken by an adult male speaker in the sentence, “The tuba hovers over the hut.” This sentence is the same sample used for Figures 6 and 9 above. The lowermost EGG trace (second trace from the bottom) is typical of a waveform from an electroglottograph in which the internal (non-linear-phase) high pass filtering is bypassed or lowered in frequency in order to avoid phase distortion near the voice fundamental frequency. The waveform contains considerable low frequency artifactual variation that, for the analysis discussed in this paper, should be eliminated or reduced without distorting the pulses caused by the variation in vocal fold contact area. The lowermost trace, obtained by a rough inverse filtering of the oral air flow, shows the location of the individual glottal air flow pulses during the sample. The air flow trace has been shifted left by about 4 ms to compensate for the unequal delays in the flow and VFCA traces, as described above for Figures 6 and 8.
The top two traces in Figure A-1 show the VFCA waveform with the low frequency variation removed by simple high pass filters of types often used for this purpose, namely, a single real-pole high pass filter (trace B), and two identical cascaded single real-pole high pass filters (trace A). (A “real pole” is one way of describing the transfer function of an electrical network with a capacitor in series with the signal followed by a resistor to ground, the simplest and most common high pass configuration.) The -3dB cutoff frequency of 50 Hz for each filter was well below the lowest signal components of interest. Though the low frequency energy is effectively removed by the two-pole filter, and fairly well removed by the single-pole filter, the shapes of the individual pulses have been significantly distorted by the action of the filters.
In contrast to the top two traces from the standard filters, the third trace shows the VFCA waveform after processing by an LPHP filter constructed using an eight-pole-Bessel-derived version of the MDS circuit configuration described by Ng and Rothenberg (1982). The -3dB cutoff frequency for this filter was also 50 Hz. As with the air flow trace, the linear-phase filtered VFCA trace has been shifted left with respect to the real-pole filtered traces to compensate for the delay introduced by the linear-phase filter (about 20 ms) so that all traces are in a correct time alignment. The linear-phase filter configuration has an asymptotic attenuation similar to the stronger of the two standard real-pole filters (40 dB/decade) but a somewhat better cutoff sharpness (Ng and Rothenberg). Note that with the linear-phase filter, the shape of each glottal pulse has been retained while the average value has been moved to approximately zero. It can be seen from this example that the LPHP filtered waveform allows the implementation of an average-value-level criterion by means of a zero-crossing-level analysis, and would also make a %-level analysis more accurate.
|
|