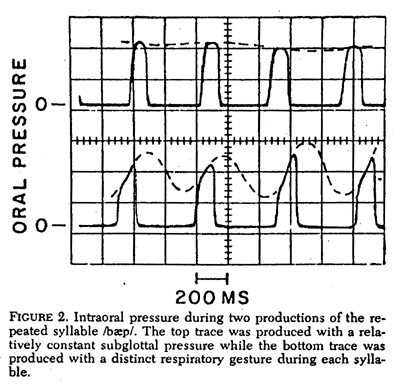
To illustrate the effect of too slow a response time, the oscilloscope traces below show the simultaneous response of two transducers to a repetition of /pa/, when each was connected to a catheter between the lips. The amplitude calibration was the same for both transducers; however, because of different catheters, one had a total response time, defined here as the time required for attaining 95% of a sudden change, of roughly 40 msec, while the other required about 1.80 msec. The slower system only attained 85-90% of the true oral pressure before the release occurred for closure periods of 100 to 150 msec. The response of the fast-responding transducer shows a flat or slightly rounded peak, that approximates the subglottal pressure during the lip closure, while the slow-responding system shows a sharp peak at the instant of articulatory release.
To measure the system response time, it is not sufficient to measure the response to the electronics alone, as Smitheran and Hixon appear to have done. They are not clear on this point, but the pressure curve in their Figure 1. indicates a frequency restriction on the complete pressure system much lower than the 30 Hz they mentioned. Though the time scale in the figure permits only a very rough estimate, I would judge the time constant t of the primarily system-determined pressure decay after each release (the time required to reach 1/e of the initial value), to be roughly 25 msec. Using the equation fc = 1/2tp which is valid for simple dynamic systems of this type, I would estimate the total system frequency response to be flat to only about 6 Hz. The total response time, as defined above, is about three times the time constant for a simple, exponential response, and so would be about 85 msec. With this restriction, the measurements of peak oral pressure made from Figure 1. would have been about 5% low.
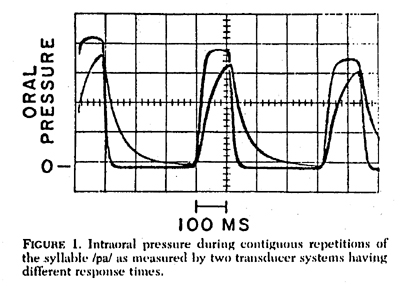
I would also favor a syllable repetition rate somewhat higher than the 1.5 per second that they chose, because of the possibility of the subject making separate respiratory gestures for each syllable at rates slower than about 2 per second. Variations of respiratory activity within a syllable tend to invalidate the continuity assumption on which this method is based. Respiratory gestures within the syllable can usually be detected by a significant variation of oral pressure within the period of articulatory closure, especially a peak at or just before the release, as shown in Figure 2, made by repeating the syllable /b ae p/ with a relatively constant subglottal pressure (top trace), and with separate respiratory gestures for each syllable (bottom trace).
In order to see the true variation of oral pressure in the pressure tracing, the system response time must be no greater than about 1/3 the closure period. Since closure periods of as little as 90-100 msec can be expected, it would be necessary for the pressure system response time to be no greater than about 30 msec, with no insignificant resonances or overshoot due to the transducer diaphragm, the acoustic system formed by the catheter and air chamber over the diaphragm, or the conditioning electronics. A resonance-free response in under 30 msec should be easily attainable with a number of transducers now available. The system response in this case was about 10 msec, as can be verifed by the return-to-zero speed after each release, and so the waveform during the period of complete closure is a fairly good indicator of the subglottal pressure during that period. The primary exception is the occasional small decrease in pressure prior to the sharp drop signaling the articulatory release. This small decrease in pressure is probably caused by the closure of the vocal folds as they come to the position for voicing (for the /b/ during the period of articulatory closure, and momentarily seal the oral cavity. Since the mandible is dropping for the articulatory opening at this time, the volume of the oral cavity is increasing, and so the oral pressure would show a decrease that may not be present in the subglottal pressure. (This artifact does not occur when using only a /p/ for the intervocalic consonant.) To clarify the relationship of oral and subglottal pressures with a fast-responding sensing system, the dashed lines in Figure 2 were sketched to show what the underlying subglottal pressure variation might have been for each case, neglecting the slight decrease in subglottal pressure during the vowel caused by the airflow acting on the subglottal flow resistance.