Induced transglottal pressure variations during voicing
Martin Rothenberg and James Mahshie
Published in the Journal of Phonetics (1986) 14, 365 – 371, © 1986 Academic Press Inc. (London) Ltd.
Summary: The response of the vibratory pattern of the vocal folds to externally induced changes of supraglottal pressure was measured. Tracings of the variation of F0 after a step change in pressure indicated that a pressure variation similar to a single bipolar cycle of an 8 – 10 Hz sinusoid is fast enough to vary the average transglottal and / or intraglottal pressure without stimulating compensatory action during the induced pressure pulse and slow enough to allow the vocal fold oscillatory behavior to respond to the change in pressure during each half of the pulse. An example is presented of the shape of the glottal airflow pulse during a continuous 10 Hz sinusoidal induced pressure variation, as derived by inverse filtering oral airflow.
1. Introduction
The glottal sound source is driven by the average transglottal pressure, Ptg, that is, the average difference between subglottal pressure, Psg, and supraglottal or oral pressure, Po. To study the effects of a variation in average transglottal pressure without the confounding effects of the change in laryngeal adjustment that would be expected with a voluntary pressure change, a number of researchers have mechanically induced variations in either the subglottal or oral pressure (Ladefoged, 1962; Öhman & Lindqvist, 1968; Lieberman, Knudson & Mead, 1969; Hixon, Klatt & Mead, 1971). Average subglottal pressure can be varied by vibrating the chest and / or abdomen at a rate much lower than F0, while oral pressure can be varied by having the speaker vocalize into some form of mask coupled to a source of pressure variation. In the experiments reported here, we attempted to verify that the time interval of the induced pressure variation could be kept short enough to avoid compensatory physiological adjustments, yet still long compared to the glottal period and the time required to attain a new vibratory steady state.
It should be recognized, however, that varying subglottal pressure is not strictly equivalent to varying supraglottal pressure. As illustrated in Fig. 1, we will use the notation Po and Psg for the time-averaged supraglottal (oral) and subglottal pressures, respectively. If we look at a profile through the glottis, from trachea to pharynx, of the time-averaged pressure, we will see a drop from Psg to Po, with the pressure half way from trachea to pharynx tending to be near the average of Psg and Po. If we define an intraglottal pressure, Pig, to be the average of Psg and Po, we can say that Pig roughly determines the average lateral forces on the vocal folds that result from the air pressure within the glottis. Returning now to varying Ptg by varying either Psg or Po, we can see that increasing Ptg by increasing Psg will tend to increase Pig, while increasing Ptg by decreasing Po will decrease Pig. Thus these two methods of varying Ptg may result in some difference in the average separation of the vocal folds and, therefore, in the nature of their vibratory behavior.
2. Method and results
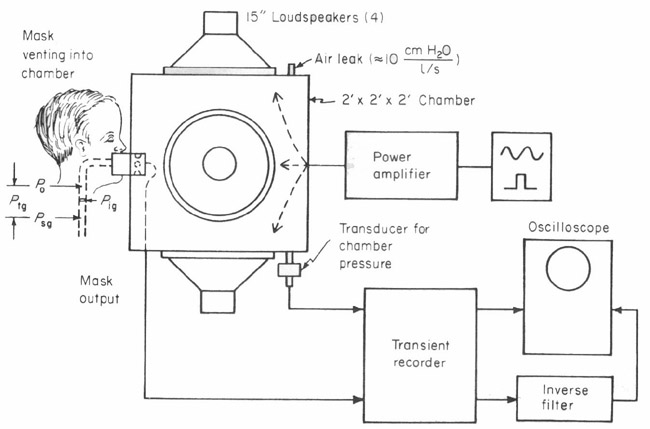
Our laboratory has varied Ptg by varying either the pressure at the mouth, to change Po, or the air pressure surrounding the thorax and abdomen, to vary Psg. The results presented in this paper were obtained using the system for varying average oral pressure shown in Fig. 1. In this system, the speaker vocalizes into a circumferentially-vented wire screen pneumotachrograph mask (Rothenberg, 1977). A differential pressure transducer measuring the pressure difference across the wire screen flow barrier records the oral airflow with a frequency response flat to approximately 1,000 Hz. If the nose is not included in the mask, it must be occluded to prevent air leakage.
The mask vents into a wooden chamber having four large loudspeakers in its walls capable of producing pressure variations in chamber pressure of over + 2 cm of water, with a response time of about ten milliseconds. A small air leak prevents any significant pressure buildup in the chamber due to the respiratory airflow during speech. A pressure transducer monitors the box pressure, and the box pressure and oral flow waveforms can be recorded directly or stored on magnetic tape.
The transient recorder is used for storing a short segment and reproducing it repetitively. Repetitive playback is required to derive the glottal flow waveform from the oral flow waveform by means of the manually adjusted inverse-filter. The procedure we used for adjusting the inverse-filter parameters has been described previously (Rothenberg, 1977).
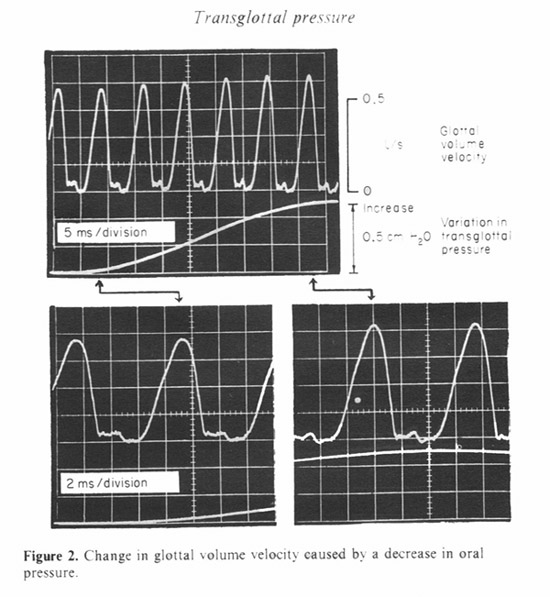
We have used sinusoidal and pulsed waveforms for the driving function to the chamber. Figure 2 shows the response to a sinusoidal variation in chamber pressure at 10 Hz. The glottal flow waveform is shown as the chamber pressure varies between the minimum and maximum values. The variation in transglottal pressure shown is actually the inverse of the chamber pressure, since an increase in chamber pressure is equivalent to a decrease in transglottal pressure. The vocalization was made at an approximately average pitch and subglottal pressure for this adult male speaker.
The glottal flow is shown expanded for the minimum and maximum pressure conditions. It can be seen that for this sample the increase in pressure caused a taller and narrower glottal pulse. Since the duration of the interval of glottal closure remained about the same, the narrowing of the glottal pulse caused a small increase in fundamental frequency.
Though such observations are consistent with the findings of others, we have been concerned about whether our results are sensitive to the frequency of the pressure variation (10 HZ in this example). There is also a possibility that the presence of a continuous oscillation in transglottal pressure encourages the speaker to use some abnormal laryngeal adjustment or induces a variation in the subglottal pressure, especially if the frequency used is near a resonance of the respiratory system.
To investigate these problems, we have used the pulse-like variation in pressure shown in Fig. 3. A single pressure pulse could be triggered manually by the experimenter or automatically by the onset of voicing and could vary in width from about 50 ms to about 350 ms. Two pulse widths are shown in the figure. The onset and offset time constants, about 20 ms, were slow enough so that there is only a barely audible acoustic sensation from the pulse.
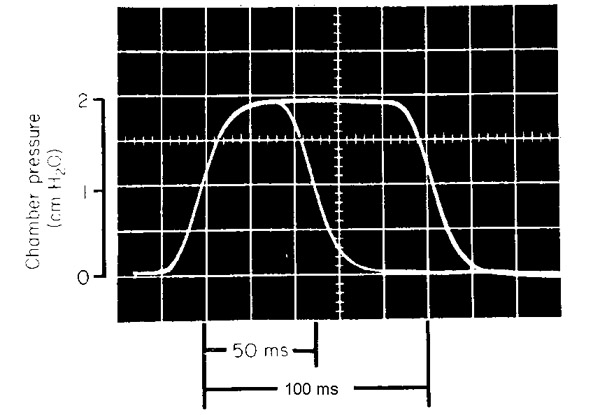

Figure 4 shows a typical result using this type of pulse during continuous voicing. We have used the vocal fundamental frequency, F0, extracted from the output of an electroglottograph strapped to the neck, as a measure of glottal action (Fourcin, 1981). It can be seen that in these samples the F0 tended to return to the value it had before the change in pressure, with a time constant of less than 100 ms. Using an exponential model for the decay, we have found that this time constant can vary from about 50 ms to over 250 ms. Similar results were obtained by Baken & Orlikoff (in press) when altering the average oral pressure by partially occluding the supragiottal air stream.
The speed at which the glottal vibratory pattern could return to its prestimulus condition was somewhat surprising to us, and so to make clearer the underlying mechanism we repeated the measurement under a number of conditions, using two adult male speakers. About 10 samples were taken in each condition. The short 50 ms pulse was used, as in the bottom example. The time constant was extrapolated from the decay during the pulse.
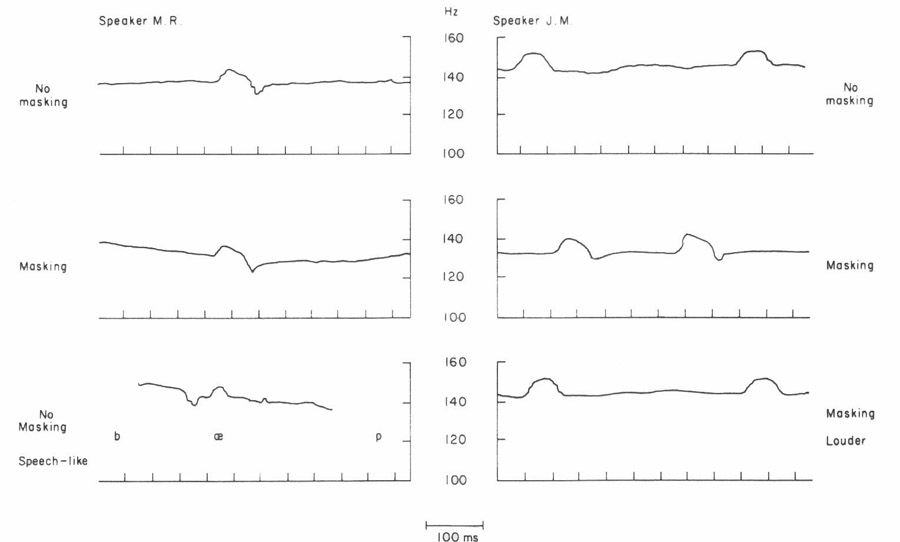
To see if the effect varied with the polarity of the pressure change, the transglottal pressure was decreased in some samples. A typical result is shown at the upper left in Fig. 5. Though the frequency change reverses, the time constant for recovery was similar to those in Fig. 4.
A plausible hypothesis might be that the recovery is at least partially due to auditory feedback. However, auditory masking, using broad-band noise and headphones, did not appear to inhibit the recovery for subject M. R., and even appeared to correlate with a faster recovery for subject J. M. in many samples, as in the one shown in the figure. The noise was set just above the level at which the subject reported not being aware of his own vocalizations.
To test for the presence of the recovery in a more speech-like mode of vocalization, in one sequence with subject M. R. the pulse was triggered during repetitions of the nonsense syllable /bćp/, while the subject was trying to mimic the intonation pattern of the first sentences of the “rainbow passage”. As can be seen at the lower left, the recovery occurred even during this speech-like mode of vocalization. During the syllable repetitions, the magnitude of the pressure pulse was only 1 cm H2O instead of the 2 cm H2O used during continuous voicing. No auditory masking was used.
For subject J. M., some continuous vocalizations were attempted at a somewhat higher than normal voice effort, as far as this could be monitored while talking into the box. As shown at the lower right, there did seem to be some reduction in the recovery effect with louder vocalization, though this effect was not always consistent. We also found no consistent correlation with fundamental frequency in the range tested (about 100 – 180 Hz).
3. Discussion
It seems to us at this time that the post-stimulus recovery in the glottal vibratory pattern may be due to a compensatory increase in subglottal pressure that is caused by, and cancels, the increase in supraglottal pressure. A simple, linear model of the respiratory system at low frequencies during voicing (Rothenberg, 1968) shows that a change induced in the supraglottal pressure will leak through the effective glottal resistance to “charge” the subglottal air compliance and tissue (lung, chest wall, and abdominal wall) compliance. The time constant associated with the highly compliant tissue movements would be much larger than the 100 ms or so noted in our measurements. However, if the tissue movements were impeded for at least 200 or 300 ms by the inertia of the abdominal and chest wall masses, the time constant of the initial rise in subglottal pressure would be determined by the effective glottal resistance and the subglottal air compliance. Assuming 80 cm H20 per l/s for the glottal resistance and a compliance of 0.002 1/cm H20 resulting from a lung volume of 2.0 liters, the time constant would be 160 ms. This is of the same order-of-magnitude as the time constants noted for the recovery in fundamental frequency.
Since the peak change in fundamental frequency occurred much less than 50 ms after the increase of supraglottal pressure, it was reached before the recovery had progressed significantly. Therefore, it may be assumed to approximate the true response of the larynx to a change in transglottal pressure of 2 10cm H20 (the value for the pulse used). Measured in this way, the change in fundamental frequency was 3.4 Hz/cm H20, with a standard deviation of 1.6 Hz/cm H20, when averaged over both speakers, for all samples taken during continuous voicing at normal loudness or vocal effort and with no auditory masking. The polarity of the pressure pulse had little effect on the magnitude of the frequency deviation under these conditions.
With auditory feedback removed by masking noise, the average frequency deviation and the range of the frequency deviations remained about the same as for the nonmasked condition, provided that the masked transglottal pressure changes were positive. However, when the transglottal pressure changes were negative under masking, the average frequency deviation increased significantly to almost 6 Hz/cm H20, with the standard deviation also being larger (about 2.7). The larger and more erratic deviations found for decreases in transglottal pressure under masking may be due to the use by both subjects of a laryngeal adjustment that resulted in oscillations which were less stable than those produced by the adjustment used without the masking noise.
Since the possibility exists that the laryngeal adjustment during continuous voicing may differ significantly from the adjustment during normal speech, the frequency deviations were also measured during the sequence of nonsense syllables /bćp/ recorded with one speaker. The smaller pressure pulse used (1.0 cm H20) and the superimposed variations in the fundamental frequency due to the natural intonation pattern made some of the induced frequency variations difficult to measure. However, for those syllables that could be measured to within about 20 or 30%, a total of 17 samples, the average deviation was 3.3 Hz/cm H20, with a standard deviation 0.9 Hz/cm H20. These values are consistent with the values obtained during continuous voicing.
Though the recovery time constant varied widely between samples, it was found that the time constant of the onset of the change in fundamental frequency tended to be constant and was not much larger than the time constant of the change in transglottal pressure. This means that a change in transglottal pressure occurring in about 20 ms is not too fast for the larynx to follow.
Transferring the time constant limitations into the frequency domain, the equation
fc = 1/2 pt
yields the frequency fc at which there is a 3 dB decrease in laryngeal response to a sinusoidal change in supraglottal pressure, if we assume a simple, exponential response to a sudden pressure change. Using this equation, the ability of the larynx to respond accurately to a pressure change having a time constant of as small as 20 ms is equivalent to the high frequency limitation being well over 8 Hz. Likewise, the fact that the step response can decay in as fast as 50 ms means that the low frequency response may be down by 3 dB at frequencies as high as 3.2 Hz.
4. Conclusion
We conclude from these tests that sinusoidal pressure variations at about 8 – 10 Hz are slow enough for the laryngeal sound source to approach a steady state vibratory pattern at the pressure maximums and minimums, and fast enough so that there are negligible recovery effects during the cycle. To eliminate the possibly troublesome effects of continuous oscillations in transglottal pressure, a waveform similar to a single bipolar cycle of an 8 – 10 Hz sinusoid could be used for the pressure variation.
The mechanism by which the fundamental frequency could recover in as little as 50 ms is not certain at this time. Since the recovery is relatively independent of auditory masking, it appears to be at least partially due to a compensatory increase in subglottal pressure. However, it would be useful to have this verified experimentally by means of direct measurements of subglottal pressure during this type of maneuver. It would also be of interest to know whether the mechanism is active or passive and, if active, by what sensory modality it is mediated.
The work reported here was supported by a research grant from the U.S. National Institute of Health.
References
Baken, R. J. & Orlikoff, R. F. (in press) Phonatory response to step function changes in supraglottal pressure. Vocal Fold Physiology: Laryngeal Function in Phonation and Respiration. San Diego, CA: College-Hill Press.
Fourcin, A. J. (1981) Laryngographic assessment of phonatory function. In Proceedings of the Conference on the Assessment of Vocal Pathology, ASHA Reports No. 11, pp. 116 – 127.
Hixon, T. J., Klatt, D. H. & Mead, J. (1971) Influence of forced transglottal pressure changes on vocal fundamental frequency. Journal of the Acoustical Society of America, 49, 105(A).
Ladefoged, P. (1962) Subglottal activity during speech. In Proceedings of the Fourth International Congress of Phonetic Sciences, pp. 247– 265.
Lieberman, P., Knudson, R., & Mead, J. (1969) Determination of the rate of change of fundamental frequency with respect to subglottal air pressure during sustained phonation. Journal of the Acoustical Society of America, 45, 1537 – 1543.
Öhman, S. & Lindqvist, J. (1968) Analysis and synthesis of prosodic pitch contours. Zeitschrift für Phonetik, 21, 164 – 170.
Rothenberg, M. (1968) Breath Stream Dynamics of Simple-Released-Plosive Production, Bibliotheca Phonetica No. 6. Basel: Karger.
Rothenberg, M. (1977) Measurement of airflow in speech. Journal of Speech and Hearing Research, 20(1), 155 – 176.
|
|