Publications of Dr. Martin Rothenberg:
Encoding Voice Fundamental Frequency into Vibrotactile Frequency
by Martin Rothenberg, Richard D. Molitor
Syracuse University, Syracuse, New York 13210
J. Acoust. Soc. Am. 66(4), 1029-1038 Oct.
1979
(Received 12 March 1979; accepted for publication 2 July 1979)
Measured in this study was the ability of eight hearing and five deaf subjects to identify the stress pattern in a short sentence from the variation in voice fundamental frequency (F0), when presented aurally (for hearing subjects) and when transformed into vibrotactile pulse frequency. Various transformations from F0 to pulse frequency were tested in an attempt to determine an optimum transformation, the amount of F0 information that could be transmitted, and what the limitations in the tactile channel might be. The results indicated that a one- or two-octave reduction of F0 vibrotactile frequency (transmitting every second or third glottal pulse) might result in a significant ability to discriminate the intonation patterns associated with moderate-to-strong patterns of sentence stress in English. However, accurate reception of the details of the intonation pattern may require a slower than normal pronunciation because of an apparent temporal indeterminacy of about 200 ms in the perception of variations in vibrotactile frequency. A performance deficit noted for the two prelingually, profoundly deaf subjects with marginally discriminable encodings others some support for our previous hypothesis that there is a natural association between auditory pitch and perceived vibrotactile frequency.
INTRODUCTION
There have been many efforts to encode speech information into a vibrotactile stimulus for use by the profoundly deaf. Most recent efforts have concentrated on encoding some features of the envelope of the short-time averaged spectrum into spatial information on the skin. The spectral envelope features are usually chosen to emphasize the more important segmental linguistic information, while the spatial variable is chosen for the tactile encoding because of its importance in tactile information processing. However, in this paper we are concerned with some possibilities that have been relatively neglected, namely, encoding the fundamental frequency of the voice (F0) instead of the spectral envelope and exploring the extent to which F0 might be profitably encoded into the frequency of a vibratory stimulus rather than its location.
Though voice fundamental frequency is not the most important parameter in speech production, it is certainly important to the naturalness and acceptability of speech and encodes much phonological, syntactic, and semantic information, even in a nontone language such as English (Nakatani and Schaffer, 1978). It is also a feature that is difficult to track in speech reading and for which there seems to be little proprioceptive feedback. For these reasons, it is no surprise that information about voice fundamental frequency has been found to be important as an adjunct to speech reading (Risberg, 1974; Risberg and Lubker, 1978).
Efforts to correct the voice pitch of the deaf by means of visual instrumental feedback can be traced back as far as 1935 (for example, Hudgins, 1935; Sterne and Zimmerman, 1939), and a tactile spatial variable has been used for this purpose more recently by Stratton (1974). Other vibrotactile speech aids, such as the direct conversion of the speech wave to mechanical vibration used by Gault and his associates (Gault and Crane, 1928), or more modern "vocoder" techniques (Englemann and Rosov, 1975; Saunders, 1974) may also be supplying some fundamental frequency information. As Stratton and others have shown, some aspects of the control of voice fundamental frequency can be improved significantly using an alternate sensory modality to display the F0 patterns of both the teacher and student, though little attempt has been made to delineate quantitatively the amount of information that can be received through particular displays when used for communicating F0 patterns during ongoing speech (as compared to the nonreal-time display of a stored F0 pattern of a short speech segment, as on a storage-type oscilloscope). If a display is to be used as a portable aid throughout the day, it is generally conceded that a tactile device holds the most promise, although visual aids may sometimes be preferable in a training situation. In this work we explore the use of vibrotactile frequency for this purpose.
Perhaps the most significant reason for studying a transformation from F0 to vibratory frequency is that measurements of frequency difference limen for vibrotactile sensation indicate that the amount of information that can be encoded into stimulus frequency may be similar to that needed to communicate at least rough distinctions of sentence intonation (Rothenberg et al., 1977). In addition, there is some evidence that the vibrotactile sensation of frequency (vibrotactile "pitch") below about 100 Hz may be closely analogous to the sensation of auditory pitch in that range; these two sensations are generally reported by hearing observers to be subjectively similar, and in a previous study we have found vibratory pitch to be somewhat easier for hearing observers to learn to interpret than for deaf observers (Rothenberg et al., 1971). The "naturalness" of a tactile sensation (the degree to which it is subjectively analogous to the auditory sensation) may be especially important when we consider the ability of the sensory replacement to reinforce early, speech-directed vocalization in deaf infants.
Another reason for studying the transformation of F0 to vibratory frequency is that it is often noted that some severely to profoundly deaf; persons employing a hearing aid with a high degree of amplification may be using primarily the vibrotactile sensations arising from voice amplitude, pitch, and timing.
Finally, we would like to explore the degree to which any parameter of a vibrotactile sensation at one skin location can be used to encode information under the dynamic constraints imposed by natural speech. Because they are relatively well matched in information rate, the combination of voice fundamental frequency and vibrotactile frequency appears to be a reasonable choice for studying the limitations that maybe found when encoding linguistic information into other sensation variables.
But what might be the parameters of an efficient transformation of F0
into vibrotactile frequency? Measurements of difference limen for vibrotactile
frequency (summarized in Rothenberg et al., 1977) indicate that there
are at least ten discriminable steps in frequency in the range 10 to 300 Hz,
relatively independent of the vibration site and vibration amplitude. Ten Hertz
represents an approximate lower limit for the range of vibration frequency if
the modulation is to occur at natural speech rates. Frequencies above 300 Hz
are not of much interest for frequency discrimination, since the sensitivity
of the skin above 300 Hz falls rapidly, and the frequency discrimination limen
is very high. How- ever, some ambiguity occurs in interpreting the frequency
discrimination limen data above about 100 Hz, since the nature of the sensation
changes from a buzz to a more diffuse sensation in which differences of frequency,
even though detectable, may not have a readily identifiable direction. In the
encoding of a speech-derived signal it is necessary to be able to discriminate
not merely the presence of a frequency change, but also its direction.
I. METHOD
A. Apparatus
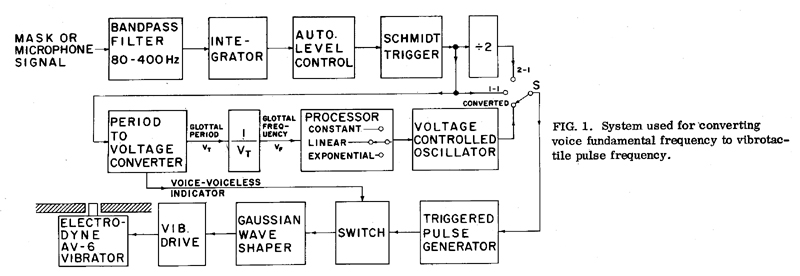
To test various transformations of F0 to vibrotactile frequency, we have constructed a flexible system for converting fundamental frequency into pulse frequency. This "F0 encoder" has five modes of operation which allow it to be used for a number of control experiments. The encoder is shown schematically in Figure 1. The bandpass filter, integrator, automatic level control, and Schmidt trigger circuit comprise a fundamental frequency extractor that generates a short pulse for every cycle of the fundamental frequency component of the voice. In this study, the signal from a fast,-responding pneumotachograph mask was used as the input instead of a microphone signal to improve the accuracy and reliability of fundamental frequency extraction (Rothenberg, 1977). The period-to-voltage converter and inverter generate voltages proportional to glottal period and frequency, respectively, that lag the actual waveform by only one glottal period. A visual examination of tracings of the extracted glottal period and frequency indicated that there were no extraction errors (missed glottal pulses or large errors in period) that would be significant in this experiment.
Also generated is a binary signal indicating the presence of voiced speech. This signal, by means of the switching circuit, removes the drive from the vibrator when no voicing is present. The processor circuit, when connected by setting the function switch S to "converted", provides three options for controlling the frequency of the voltage-controlled oscillator which generated the pulse train.
In the "linear" and "exponential" modes, any range of F0 can be converted to a preselected range of pulse frequency according to either a linear or exponential relationship. Since our previous data indicate that the equally perceptible intervals of vibrotactile pitch are distributed uniformly on an exponential scale, one would expect that an exponential scaling of F0 to tactile frequency would be optimum if the F0 variable in natural speech is distributed symmetrically about its mean and not already skewed toward the higher frequencies (as would be the case if there was already an exponential scaling in the physiological mechanism for varying F0). Since the only statistical studies of the distribution of F0 that we had found in the literature, namely, an older study by Fairbanks (1940) and the recent study of the intonation in one short sentence by Atkinson (1976), were ambiguous in this regard, we included both an exponential and a linear conversion in our design for the converter.
In the "constant" mode, the oscillator frequency is held constant at about 40 Hz for use in a control experiment in which only durational information is present in the vibrotactile stimulus.
A fourth mode provided for by the function switch permits the vibratory pulses to occur in one-to-one synchronism with the cycles of the fundamental frequency component. This mode of operation is analogous to placing the hand directly on the throat of the speaker or on a vibrator driven by the voice. It allows us to determine whether our hypothesized optimum conversion of F0 is any better than feeling F0 directly.
A fifth mode allows the vibrator to be driven by F0/2. In this position a vibrotactile pulse is generated for every second glottal pulse. This type of down scaling of F0, dividing by a integer constant, would be especially convenient in a practical implementation. Except for small differences near the onset and offset of voicing, a similar result can be obtained by using an appropriate adjustment of the "linear-converted" mode. However, "¸2" was included as a separate position because of its ease of implementation and practical significance.
The final pulse-shaping filter is designed to provide the 1-ms Gaussian pulses
that our previous experiments indicate are desirable for this application (Rothenberg
et al., 1977), though other stimulus waveshapes are also possible.
B. Stimuli
The stimuli were repetitions of the all-voiced sentence "Ron will win(.)
(?)" spoken with the six following stress patterns:
| 1. Ron will win. | 4. Ron will win? | |
| 2. Ron will win. | 5. Ron will win? | |
| 3. Ron will win. | 6. Ron will win? |
The intonation patterns for these sentences are described by Atkinson (1976).
A stimulus tape was made by recording both the acoustical pressure (microphone) waveform and the oral air-flow waveform during a total of 60 sentences, 10 with each stress pattern, as spoken in random order by a phonetically trained male speaker. An attempt was made to keep the stress at a moderate level, slightly stronger than in the average speech situation, but with a natural variation in the way each stress pattern was actualized. A few test items were replaced in which the stress pattern was not clear when the unprocessed speech was played back acoustically.
To determine the range of fundamental frequency variation used, a voltage proportional to F0, obtained by playing the master tape through the F0 encoder, was traced on a chart recorder. The authors then examined the resulting trace to determine an approximate frequency range that would include the middle 90% to 95% of the frequency values. This range was measured to be approximately 80 Hz, centered about 125 Hz. (No finer or more exactly specified "range" is required for these experiments.)
From this master tape, a series of ten test tapes was made, one for each conversion of F0 to vibratory rate, by extracting F0 from the airflow signal on the master tape and converting the frequency using the apparatus described above. The conversion used for each test tape is indicated in Table I.
For example, tape 1 contained one pulse for every glottal pulse detected, while
on tape 5 the frequency range of the F0 deviations was
reduced by a factor of 0.75 with the approximate center frequency lowered to
50 Hz. The frequency range for tape 5 would then be 60 Hz wide, and extend from
about 20 to 80 Hz. For the exponential conversions, the range of frequency variation
was kept roughly the same as for the equivalent linear tape, but the conversions
followed the exponential equation Fvib = K1exp(K2F0).
The variations in vibratory frequency were therefore compressed at lower frequencies
and expanded at higher frequencies. In tapes 8 and 9 the center frequencies
were made similar to the linear equivalents, while in tape 10 the center frequency
was reduced enough to take the end points of the exponential range similar to
those of the linear equivalent.
TABLE I. Tape descriptions
|
Tape
|
Scale
Factor |
Center
frequency (Hz) |
Approximate
frequency range (Hz) |
Mode
|
|
1
|
1:1
|
124
|
85-165
|
linear (synchronous with glottal pulses)
|
|
2
|
1:2
|
120
|
40-200
|
linear
|
|
3
|
1:0.5
|
120
|
100-140
|
linear
|
|
4
|
1:1
|
50
|
10-90
|
linear
|
|
5
|
1:0.75
|
50
|
20-80
|
linear
|
|
6
|
1:0.5
|
62
|
43-83
|
linear (every second glottal pulses)
|
|
7
|
1:0.5
|
50
|
30-70
|
linear
|
|
8
|
exponential equivalent of tape 1, centered at 120 Hz
|
|||
|
9
|
exponential equivalent of tape 4, centered at 50 Hz
|
|||
|
10
|
exponential equivalent of tape 4, centered at 40 Hz
|
|||
Table II. Hearing impaired subjects. Hearing level indicated is the pure-tone
threshold at the best frequency for the best ear
|
Subject
|
Sex and age
|
Onset of hearing loss
|
Hearing
|
Uses aid
|
Primary communication
|
|
T.B.
|
M-19
|
congenital
|
70 dB (125 Hz)
|
yes | speech |
|
D.E.
|
M-24
|
congenital
|
none
|
no | speech & recently manual |
|
M.M.
|
F-24
|
at birth
|
60 dB (250 Hz)
|
yes | speech & manual |
|
L.C.
|
F-55
|
congenital
|
none
|
no | manual |
|
A.C.
|
M-64
|
5 yrs
|
none
|
no | speech & manual |
C. Subjects
The subjects consisted of eight normal-hearing and five hearing-impaired persons. The normal-hearing subjects were young adult undergraduate and graduate college students; Only a few had any significant phonetic training.
The hearing-impaired subjects are described in Table II. As can be seen in the table, they represent a wide range of hearing impairments, from severely to profoundly deaf and including both prelingual and post-lingual losses.
The only subject having an apparent sensory deficit that was significant in
these experiments, other than a hearing loss, was A.C., whose tactile amplitude
thresholds were about 10 to 15 dB higher than those of the other subjects. This
may have been due to his age (64 yr).
D. Experimental Procedures
Subjects were seated in a sound-treated booth, the left arm resting comfortably on a shelf of about table height adjacent to the chair. An Electrodyne model A V-6 vibrator was mounted beneath this shelf, so that a 0.28 cm2 contactor on the vibrator was centered in a 5/16 in.-diam hole in the shelf and adjusted to be flush with the shelf top. During tactile stimulation, the subject's forearm was positioned so that the contactor was at a point midway between wrist and elbow, except for one subject on which the thenar eminence of the palm was used, as explained below. For tests using auditory reception, the arm was removed from the vibrator.
In order to prevent subjects from hearing the vibrator during tactile stimulation, they placed cotton in their ears and wore circumaural headphones with masking noise that was low-pass filtered to 1200 Hz. The noise level was set individually to a level thought to be well above that sufficient for masking, but not so high as to cause discomfort. In the event of unusually high scores, the questionable tape was rerun with higher intensity masking noise and the results of the two runs were compared. If the score of the second run was significantly lower than the first, it was assumed that hearing may have occurred on the first run and the second run score was used. Subsequent tapes were then run with the higher masking noise level. This occurred only a few times during the testing.
During the experiment, the test tape stopped automatically after each test item (sentence) in order to allow time for a response and was restarted manually by the experimenter. The subject communicated the response by a number (one through six), with a chart showing the correspondence between number and stress pattern always visible. Communication was aural if possible or with a hand sign otherwise. Except when the effect of pulse amplitude was being tested, the pulse amplitude was set to be 14 dB above the subject's threshold for a 40 pps pulse train, as obtained at the start of each test session, using the method of limits.
The subjects received about two hours of training in which they were given portions of typical test tapes and informed as to the correctness of their response. For hearing subjects, the training began by having the subjects identify the stress pattern in aurally presented repetitions of the spoken sentence (unprocessed). After a subject correctly identified 12 sentences in a row (which occurred quite quickly), he/she was switched to an aurally presented series of pulse-encoded sentences until 12 in a row were correct (which also occurred quickly). The remainder of the training was with vibrotactile pulses. This training was in units of 60 sentences, 30 at a center frequency of 124 Hz (from tape 1) and 30 at 50 Hz (from tape 4), and ended when the score on the lower frequency sentences (which were invariably easier to identify than the higher frequency ones) reached a level of 40% correct. This took between two and four units, depending on the subject. Our experience in pilot tests indicted that at this score level the subject understood the task and that one or two units more would result in little additional increase in performance.
Except for the one subject discussed separately below, the training was not so extensive as to indicate a performance limit, since the purpose of this experiment was primarily to determine a relative ranking of the various encodings and any gross perceptual limitations. It should be understood that in limiting the' training, we were attempting to reduce the boredom factor, which was significant with most subjects by the end of the test series. The fact that two subjects could not complete the series was at least partially due to this factor.
The deaf subjects generally required some preliminary informal instruction in identifying increases and decreases in vibrotactile frequency using a manually adjusted oscillator to control the vibratory rate and hand motions to communicate "higher" and "lower".
They were then given the same vibrotactile training as the hearing subjects. The average training time required by the deaf subjects was only slightly higher than that required by the hearing subjects.
After the initial training period the subjects went through the test tapes in a sequence that was counter- balanced between subjects to control for learning. In addition, to prevent a subject from memorizing the correct sequence of test items, the 60 items making up a test tape were recorded in two different orders, which were alternated in each subject's sequence of test tapes. Learning during the test sequence was measured by having each subject redo his/her first tape at the end of the sequence. For those tapes retested that were linear, and therefore reported below, the scores shown are the average of the two trials.
After the initial training, the only feedback as to the correct response was during a short familiarization sequence (18 stimuli) that preceded each test tape and used the same encoding as the test tape. The responses during this sequence were not used in the scores reported here.
After going through the text tapes, using the procedure described above, one
subject was put through an additional lengthy training procedure described separately
below.
II. RESULTS
A. Normal-hearing subjects
As a check for the influence of duration in signalling the stress pattern, one of the "better" hearing subjects was tested with duration the only variable, i.e., with the vibratory frequency constant at 40 Hz. However, she performed only at chance and reported receiving no information from the vibratory input.
The exponential tapes were used with only the first five hearing subjects, since it became clear at that point that there were no significant differences in average performance between the linear and exponential equivalents. Results reported below are only for linear tapes.
The results for the hearing subjects are shown in Figure 2. Each data point in this figure represents the performance of one subject on that tape (60 stimuli), with the group mean and standard deviation for each tape traced by the solid and dashed lines, respectively. The tapes are ordered according to decreasing mean score.
The three columns at the left show that when the subjects were allowed to listen to the vibrator, the patterns were identifiable at about the 80% level, even if the range of variation was halved (tape 3) or if the frequencies were reduced by one octave (tape 6).
The results for tactile stimulation show that, as expected, pattern identification at the natural voice frequencies (tape 1) was very poor. However, an average level of about 50% correct was attained (with chance being 1 out of 6, or 16.7%) when the normal F0 range for the speaker was either expanded by a factor of two (tape 2) or shifted down to a center frequency of 50 Hz (tapes 4, 5, and 7).
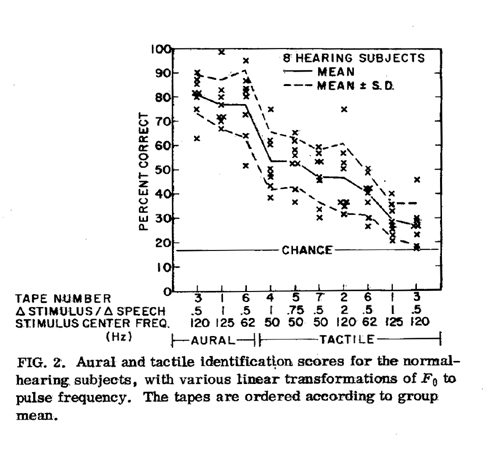
A straight reduction of one octave (tape 6), which lowered the center frequency
to about 62 Hz and com- pressed the frequency range by 1/2, was also fairly
interpretable. Though the range of frequency variation in tape 6 was similar
to that in tape 7, the performance was slightly better on tape 7, presumably
because of the lower center frequency on that tape.
Tape 5 had the same 50-Hz center frequency as tape 7, but with the range of variation expanded by 50%, and this apparently improved the discriminability of the intonation patterns. However, increasing the range of variation still further, as in tape 4, resulted in no further improvement. Subjects reported that the patterning in the frequency variation was sometimes hard to identify at the very low pulse rates (about 10 Hz) reached in some test items on tape 4.
Unlike the result with aural reception, a compression by a factor of two without reducing the center frequency (tape 3) resulted in an almost complete loss in intelligibility for most of the subjects.
The fact that one subject did reasonable well on tape 3 (46% correct) and another subject did very well on tape 2 (75% correct) is not easily explained. There is always the possibility of significant auditory transmission existing, in spite of our control procedures. How- ever, the subject scoring 75% on tape 2 was confident that she could not hear the stimulus. In addition, on three subsequent tapes run on that day under the same conditions, her scores were not unusually high.
An alternate hypothesis is suggested by our previous observation (Rothenberg et al., 1977) that the difference limens for frequency above about 100 Hz tend to be smaller when the subject is only required to identify the presence of a difference or a change in frequency than when he/she is asked to identify in some way the polarity of a difference or change in frequency. Below 100 Hz, the polarity of a frequency difference is easy to identify as long as the two frequencies are far enough apart to be sensed as different (at least for normal- hearing observers). However, it is possible that at frequencies above 100 Hz, as found throughout tape 3 and in most of tape 2, the sensory correlates of frequency are not immediately interpretable, but can be learned with sufficient training. It may be significant in this regard that, because of the way the tapes were sequenced in the counterbalanced presentation, both of the unusually good performances were immediately preceded by other high frequency tapes.
The results for the frequency-lowered tapes are generally consonant with the
frequency difference limen studies described above, except for the drop of 30
percentage points from aural reception that apparently could not be overcome
by an expansion of the frequency range. (If the additional errors on the skin
were caused only by a larger frequency discrimination limen, they could have
presumably been eliminated by expanding the frequency range sufficiently.) There
seemed to be two I causes for the 30 percentage point difference, namely, a
relative lack of experience in interpreting the tactile stimulation and a difficulty
in making temporal judgments in the tactile mode. These two factors are considered
further in Secs. C and D below.
B. Results for deaf subjects
The results for the five deaf subjects are shown in Figure 3 along with the mean performance of the hearing subjects. The missing points on the graph reflect the fact that subject L.C. was not available to complete tapes 3 and 4, and subject M.M. did not complete tapes 1 and 3. Tests were on the forearm, except for subject A.C. Because of his high amplitude threshold on the forearm, we could not reach 14 dB SL without overdriving our vibrator. Since we have found no performance differences between forearm and thenar (see below), we decided to run subject A.C. on the thenar eminence, at 14 dB SL.
It can be seen in Figure 3 that the deaf subjects as a group performed within the general range found for hearing subjects. Some differences are that the deaf subjects tended to score lower on the tapes at higher frequencies (near 120 Hz) and that they apparently had more trouble than the hearing subjects in interpreting the low pulse rates present on the most highly expanded low-frequency tape (tape 4).
Since the deaf subjects differed in the nature of their impairments, we have identified the scores in Figure 3 by the subject. It should be kept in mind, however, that the ranking of the tapes for each subject depended slightly on the order in which they were taken, since there was probably some learning through the test series. (Deaf subjects were not retested for learning at the end of the series.) As with the hearing subjects, any learning effects would be reduced in group data by the counterbalancing of the order of presentation. Though there were not enough deaf subjects for a complete counterbalancing, the tape order was counterbalanced as much as possible.
In analyzing the results shown in Figure 3, we were especially interested in the degree to which they indicated whether or not vibratory pitch was a natural analog to auditory pitch. This thesis would be supported if subjects with a greater degree of experience with auditory pitch performed better than those with less experience when asked to discriminate variations in vibratory pitch.
We find some evidence supporting this hypothesis in Figure 3. The postlingually deaf subject, A.C., performed better than the prelingually deaf subjects at most frequencies, while the lowest scoring subject, L.C., was prelingually deaf and used no hearing aid.
Opposing our hypothesis is the fact that subject D.E., also profoundly deaf
from birth, scored quite well on most tapes. Subject D.E.'s generally good performance
may be explained by his wide experience in interpreting vibration. He was a
graduate student in electrical engineering with a strong experimental background
and had spent many hours trying to interpret vibratory stimuli, as, for example,
in constructing or testing radio receivers. (L.C.'s experience in this regard
appeared to be much more limited.) However, note that D.E. did not do as well
on tape 6, one of the marginally discriminable encodings. This tape occurred
for him in the middle of the series, and his low score could not be attributed
to its position. It is possible that in judging the effect of previous experience
we should look most closely at the marginally discriminable tapes such as number
6. When the frequency deviations are very wide, as in tape 5, the subject's
task may be more to relate the pattern to the stimulus class than it is to discriminate
the presence and direction of a variation in vibratory pitch. This interpretation
of the data is also supported by the generally poor performance of the hearing-impaired
subjects on the higher frequency tapes, since these tapes would also be considered
as marginally discriminable.
C. Improvement with training
The experience factor is measured in some degree by the test for learning made by retesting hearing subjects at the end of the series, using the first tape used by each subject (tactile presentation only). These re-tests showed improvements in performance ranging between 5 and 23 percentage points, with an average improvement of 12 percentage points. This improvement occurred even though the subjects received feedback as to the correctness of their answers only during the short familiarization sequence that preceded each test tape, and the tests extended over a period of two or three weeks.
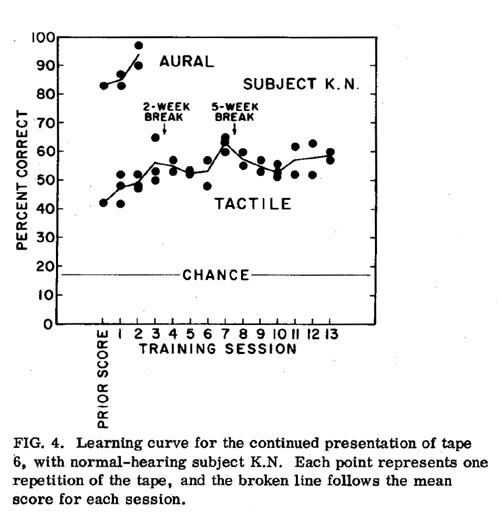
To obtain an estimate of what the improvement with prolonged training might be, one of the more consistent and motivated hearing subjects was put through a lengthy training program. Tape 6 was chosen for the training because it represented an easily implemented encoding and a level of intermediate difficulty. During the training period, the subject kept repeating this test tape, including the familiarization sequence that preceded the tape. The two versions of the tape were alternated to reduce the possibility of memorization. The correct response was identified only during the familiarization sequence in order to keep the test conditions the same as during the previous testing, so that scores could be compared.
In the learning curve shown in Figure 4, each data point represents one presentation of the test tape during a given session. The line is drawn through the average score for each session. The sessions were separated by 1 to 4 days, except for the two long breaks indicated in the figure, which occurred when the subject was not available. Except for two sessions, the lowest score was made with the first presentation of the tape. Therefore, if the first presentation was considered a practice period, the learning curve would fall slightly above the mean performance line shown in the figure.
Our interpretation of the data shown in Figure 4 is that the subject could, with sufficient training, achieve scores between 60% and 65%, but that higher scores were not attainable. The downward drift of the scores to about 55% after the third and eighth weeks could be attributed to the long breaks in the training. Thus, this subject was able to raise her score by about 20 percentage points above the level attained with the minimal training given all other subjects.
In order to determine whether the improvement with training occurred because of an improved tactile discrimination or because of an increased familiarity with the task, the same training routine was repeated with the subject listening to the vibrator. Tape 6 was used again. With aural reception, it could be assumed that the errors were due to a lack of familiarity with the task (hearing isolated fundamental frequency contours) and not due to an inability to perceive the frequency contours.
The results of the aural training are shown at the top of Figure 4. It can be seen that with only a short training period, the score for this subject quickly rose over ten percentage points. This result indicates that most of the errors with aural reception in Figure 2, or at least about ten percentage points of the average error score, were due to a lack of familiarity with the stimuli and could have been eliminated by increasing the pretest training. Since a lack of familiarity with the task would tend to affect reception by all modalities, it seems reasonable to assume that a similar percentage of the errors with tactile reception in both Figs 2 and 4 was also due to a lack of familiarity and not to a perceptual limitation.
Considering both the aural and tactile training results, it appears that much
of the rather large intersubject variance found with normal-hearing subjects
(Figure 2) was due to the short pretest training period. Some subjects probably
"caught on" slower than others and could have increased their scores
with more training. However, we feel that the relative ranking of the tapes,
which was the primary result sought in that experiment, is likely to remain
roughly invariant with training, especially since it agrees with the frequency
difference limens reported previously and with the subjects subjective reports.
D. Error patterning and temporal resolution
The results for normal-hearing subjects, both with limited training and with extensive training, indicate that there is a sizeable tactile performance deficit when compared to aural reception ranging from 20 to 30 percentage points, depending on the encoding used. Only a small part of this deficit appears to be due to a relative lack of experience in interpreting variations in vibrotactile pitch, with the remaining score deficit apparently due to a relative difficulty in making temporal judgments in the tactile mode. Subjects reported having difficulty judging just where in the utterance a rise or fall occurred. This difficulty is also reflected in the confusion matrix data in Figure 5. This matrix was obtained from the responses of hearing subjects to all vibrotactile stimuli except those on tapes 1 and 3. These two tapes were excluded because of the poor performance with them. (Since most responses to stimuli from tapes 1 and 3 were essentially guessed, they would be rather uniformly distributed over the matrix.) To make the matrix easier to interpret, the data are presented in terms of marks, with one mark representing 20 responses in that category, rounded to the nearest mark. Since there are few errors in the lower left and upper right quadrants, the matrix shows that the confusions occurred primarily among stress patterns of the same type (statement or question), i.e., that most errors were in identifying the word stressed and not the sentence type.
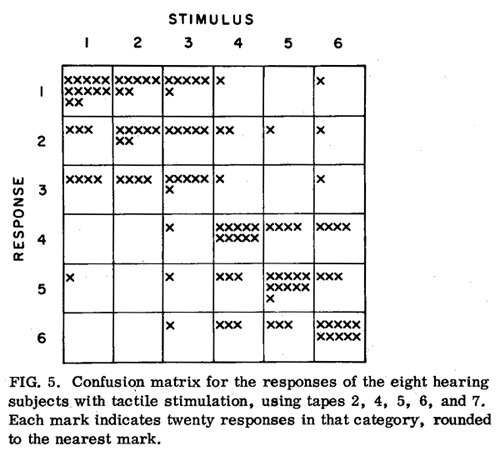
A difficulty in making temporal judgments is also indicated by the fact that when the stress was at either the beginning or end of the sentence, and not located correctly by the subject, the location was misplaced by two words about as often as by one word. This suggests that the entire temporal patterning of the sentence was sometimes hard to perceive and that the subject would guess a location in those cases.
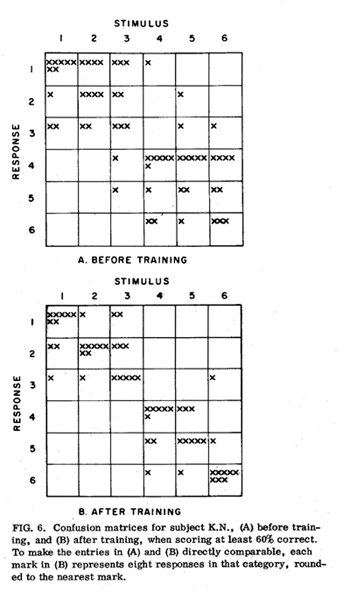
We were also interested in what types of errors were corrected with an increase in training. Figure 6 shows confusion matrices for the subject receiving prolonged training, both before training and during those seven tapes in the training sessions for which the subject scored 60% or better. It can be seen that before training the subject performed very much like the group average (Figure 5), with most errors being in the placement of the stress and not in identifying the sentence category. When the stress was at the beginning or end of the sentence, stress placement errors of two places were as common as (and, in fact, were slightly more common than) errors of one place.
After training, however, errors in identifying the sentence category were almost eliminated, and errors in the placement of stress by two places were greatly reduced. This indicates that the remaining errors were due to insufficient tactile temporal resolution and that this resolution could be increased with training to the point at which it is sufficient for consistently resolving sentence stress to within about one syllable.
If we assume that the errors in stress placement after training are caused primarily by a temporal smearing or indeterminacy in the reception of the variations in pulse frequency, then we can get some estimate of the magnitude of this smearing by looking at the percentages of one- and two-syllable errors in the post-training confusion matrix when the stimulus category was identified correctly and the stress was on either the first or last syllable. Out of 295 identifications in these categories, there were 197 correct (67%), 65 one-syllable errors (22%), and 33 two-syllable errors (11%). Keeping in mind that these errors could be reduced slightly by using the closer-to-optimal transformation of tapes 4 or 5 and that some errors may be due to other factors, we could interpret this error pattern as indicating that the temporal blurring or indeterminacy inherent in the reception of variations in vibrotactile frequency is of the order-of-magnitude of one-half of the duration of an average CVC syllable at the speaking rate used or roughly 200 ms. For example, to estimate the amount of temporal blur that could cause this error pattern, we could reduce the error a total of 10 percentage points to 17% one-syllable errors and 6% two-syllable errors to allow for a more optimal transformation (as estimated from Figure 2). If we plot the resulting points on a time scale, 6% at two syllables, 17% at one syllable, and 77% at zero error, and fit the points with a smooth curve having a zero derivative at the origin, as one-half of a normal distribution, this curve would represent the perceived point of stress if the true point is actually at the origin. It would have half its area below about one-half syllable or about 200 ms.
Though some of the estimated 200-ms indeterminacy in locating the point of
stress could possibly be ascribed to the physical indeterminacy inherent at
the lowest pulse rates in the stimulus, the high scores with the aural presentation
of tape 6 indicate that most of the vibrotactile temporal indeterminacy was
due to some limitation associated with the tactile sensory modality.
E. Effects of location and waveshape
Using five of the hearing subjects, we also explored whether an improvement in performance could be attained by moving to a more sensitive location or by Increasing the stimulus level. However, retests on the thenar eminence and on the finger using tape 6 produced little or no improvement, as did increasing the stimulus level by about 10 dB.
In an additional test with four hearing subjects, we used for a stimulus 1-ms Gaussian pulses passed through a resonant circuit having a frequency and damping similar to that of the first formant in a vowel in which the first formant is relatively low. (A resonance frequency much higher than those used would not affect the pulse waveshape significantly.) We were interested in the degree to which the tactile sense could follow the periodicity of natural speech waveforms, either directly or reduced in frequency by some factor. The resonance frequencies used were 200 and 400 Hz. Only tape 6 was used for the test.
We found that the average performance for the four subjects actually increased
from 35% correct using the standard 1-ms pulses on the same test tape, to 46%
for the 200-Hz resonator and 48% for the 400.Hz resonator. However, this increase
(about 12 percentage points) is similar to the average Increase that we found
due to learning and probably reflects, primarily, the fact that the tests using
the resonator were added at the end of the testing sequence.
III. CONCLUSIONS
These results indicate that a simple one- or two-octave linear reduction of F0 to vibrotactile frequency (transmitting every second or third glottal pulse) might result in a significant ability to identify the intonation patterns associated with moderate-to-strong patterns of sentence stress in English. For optimum discrimination, it appears that the reduction should vary with the F0 range of the speaker and be such as to transpose the upper part of the speaker's range to slightly below 100 Hz. If more subtle stress patterns are to be discriminated, it would undoubtedly be necessary to expand the tactile frequency range beyond the range resulting from simple frequency division.
Following these guidelines, the general pitch level and the grosser aspects of the intonation pattern (rising versus falling) will probably be clear even at normal rates of speech; however, an accurate reception of the details of the intonation pattern may require a slower-than-normal pronunciation because of a temporal indeterminacy of roughly 200 ms which appears from our data to be inherent in the vibrotactile reception of variations in pulse frequency.
These results, of course, are predicated on the limited training times used and may not reflect improvements in performance that might accrue from the overlearning that occurs when a stimulus code is used for natural speech reception over many years. As one example, the unusually good performance noted for two of the hearing subjects on a tape encoding information into vibrotactile frequencies primarily above 100 Hz indicates that the higher frequency range of skin sensitivity may be considerably more useful than our mean data indicate. Though these two data points are certainly not conclusive evidence that high-frequency performance can be improved markedly with practice, the possibility war rants further experimental exploration. It would mean, for example, that the potential of any device using the frequency variable above 100 Hz for conveying information could not be adequately estimated without a long training period.
The stimulus waveshape does not appear to be crucial as long as there is a sufficiently sharp pulse (£1 ms wide) and any oscillations in the waveform tend to decay between pulses. The stimulation level and stimulation site do not appear to be significant as long as there is enough sensitivity at the site chosen so that a stimulus amplitude of at least 12 to 15 dB SL can be achieved by the vibrator and is not so high as to cause discomfort.
The nature of the frequency transformation (linear versus exponential) was apparently less significant than the other variables in this study (center frequency, frequency range, amount of training), but should probably be reconsidered in the future when questions concerning these other variables are better resolved.
The question of a natural association between auditory pitch and perceived
vibrotactile frequency that was raised by our previous difficulty in training
congenitally deaf subjects to discriminate differences in vibrotactile frequency
(Rothenberg et al., 1977) was not settled by these experiments. Since
the three congenitally deaf subjects tested previously were not subjects in
the pre- sent experiments, the hypothesis that there is such an association
has received some support in experiments with a total of eight subjects, five
of which would be considered prelingually, profoundly deaf. All five evidenced
some degree of deficit in the perception of vibrotactile pitch. It appears that
if persons with no auditory pitch experience do have a vibrotactile pitch deficit,
they can overcome some of this deficit with training (as subject D.E.) and that
a small amount of residual hearing, aided by amplification, may be sufficient
to avoid this deficit (subject T.B.). However, the resolution of these questions
requires the testing of a much larger sample of profoundly deaf subjects, with
a careful consideration of the auditory and vibrotactile experience of each
subject. Our results suggest that this testing should concentrate on encodings
in which the variations in vibrotactile frequency are marginally discriminable.
REFERENCES
Atkinson, J. E. (1976). "Inter- and intraspeaker variability in fundamental voice frequency," J. Acoust. Soc. Am. 60, 440-445.
Englemann, S., and Rosov, R. (1975). "Tactual hearing experience with deaf and hearing subjects," Exceptional Children 41,244-253.
Fairbanks, G. (1940). "Recent experimental investigations of vocal pitch in speech," J. Acoust. Soc. Am. II, 457-466.
Gault, R. H., and Crane, G. W. (1928). "Tactual patterns for certain vowel qualities instrumentally communicated from a speaker to a subject's fingers," J. 'Gen. Psychol. 1, 353-359.
Hudgins, C. V. (1935). "Visual aids in the correction of speech," Volta Review 37, 637-643.
Nakatani, L. H., and Schaffer, J. A. (1978). "Hearing 'words' without words: prosodic cues for word perception," J. Acoust.Soc. Am. 63, 234-245.
Risberg, A. (1974)'. "The importance of prosodic speech elements for the lipreader," Visual and Audiovisual Perception of Speech, Sixth Danavox Symposium, edited by H. Birk Nielsen and E. Klamp, Scand. Audiology, Suppl. 4, 153-164.
Risberg, A., and Lubker, J. (1978). "Prosody and speech reading," Quarterly Progress and Status Report, April 1978, Speech Transmission Laboratory, Royal Institute of Technology, Stockholm, pp.1-16.
Rothenberg, M. (1977). "Measurement of airflow in speech," J. Speech Hear. Res. 2, 155-176.
Rothenberg, M., Verrillo , R, T., Zahorian, S. A., Brachman, M. L., and Bolanowski, S. J. (1977). "Vibrotactile frequency for encoding a speech parameter," J. Acoust. Soc. Am. 62, 1003-1012.
Saunders, F. A. (1974). "Electrocutaneous displays," in Conference on Vibrotactile Communication, edited by F. A. Geldard (The Psychonomic Society, Austin, TX).
Sterne, T.A., and Zimmerman, H. J. (1939). "A thyratron indicator for teaching the deaf," J. Sci. Instrum. 16, 334-336.
Stratton, W. D. (1974). "Information feedback for the deaf through a tactile
display," Volta Review 76, 25-35.
|
|