Measurement of Airflow in Speech
Journal of Speech and Hearing Research, March 1977, Vol. 20, No. 1, 155-176.
Airflow during speech is most often measured by placing a small acoustic resistance in the flow path and measuring the pressure drop across this resistance. The resistance element is usually a very fine mesh stainless steel wire screen, which offers a linear flow-pressure relation over a wide range of airflow (Beranek, 1954; Van den Berg, 1962). The airflow being measured is funneled through the wire screen by means of some sort of mask. The entire system is sometimes referred to as a wire-screen pneumotachograph.
When used for speech research, the wire-screen pneumotachograph has two primary deficits: the distortion of the radiated speech caused by the mask, including any tubing leading to the outside air, and a limitation on the high frequency response of the flow measurement caused by the acoustic characteristics of that part of the mask system that connects the mouth with the wire screen. It has been shown previously that both the speech distortion and the response time of the mask can be greatly improved by distributing the wire screen over the surface of the mask, primarily around the circumference, close to the mouth (Rothenberg, 1973). This paper presents in more detail the practical and theoretical information needed for the optimal design of such “circumferentially vented” pneumotachograph masks and describes some applications not commonly discussed in the literature.
MASK DESIGN
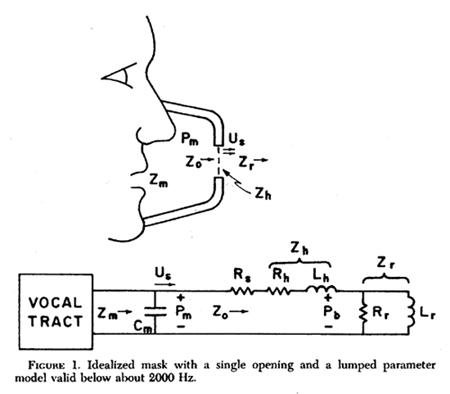
Figure 1 shows an idealized mask
having a single opening covered with wire screen. At frequencies for which the
dimensions of the mask are small compared to a wavelength, and at volume velocities
low enough such that the flow through the opening is laminar, the mask can be
represented by the lumped parameter model shown in the figure. The impedance
of the mask as seen by the vocal tract is Zm, while the
impedance at the opening is Zo. Besides the screen resistance
Rs, the impedance of the opening itself is shown to have
two components, Rh and Lh, that might
be significant, depending on the thickness of the wall of the mask. The impedance
Zr is the radiation impedance at the hole. Us
is the volume velocity through the hole and Pm the pressure
within the mask. At frequencies for which the mask dimensions are small compared
to a wavelength, Zm becomes equal to the impedance Zo,
in parallel, with a compliance Cm due to the volume of the
mask.
If the distances from the mouth to the walls of the mask are not small compared to the vocal tract length, the model can become much more complex, as for example with masks enclosing the entire face or head (Klatt, Stevens, and Mead, 1968; Hixon, 1972). For small masks, covering only the mouth or the mouth and nose, the main effect of the lumped parameter assumption is to ignore a slight lowering of the formant frequencies caused by the lengthening of the mask-vocal tract acoustic system. This lengthening effect is smallest when the holes are located primarily around the circumference of the mask.
In Figure 1 the radiation impedance is represented by a parallel combination of resistance and inertance (inductance in the circuit model), as shown by Flanagan (1972) to hold for a number of port geometries. The total radiation impedance is primarily inertive for low frequencies and becomes resistive above a crossover frequency fc given approximately by the following expression extracted from Flanagan’s curves.
|
1 |
If the opening is small, the radiation impedance Zr, and to a lesser extent the hole impedance Zh, tend to be high and inertive in phase. This high inertive loading of the vocal tract can greatly distort resonances of the vocal tract and mask system and greatly deteriorate the quality of the radiated speech.
The situation can be improved by increasing the area of the opening. To keep the mask resistance unchanged, the resistivity of the screening would have to be increased inversely with the area. In the limit, we can imagine the mask consisting of a surface of wire screen having a resistance of Rs. If this surface conformed to an equipotential surface around the mouth (a surface over which the sound pressure is the same, and the velocity direction is perpendicular to the surface), the radiation impedance Zr would approach the radiation impedance of free space, and the increase in Zm caused by the mask would only be that due to Rs in parallel with the compliance of the enclosed air.
In a practical mask, it may not be convenient to have the mask conform with an equipotential surface. The mask must be made to conform comfortably to the face and usually is made to include the nose. Also, if the mask is to be used for high-frequency airflow measurements, the pressure transducer must be mounted on or very close to the mask, in some location not too far from the mouth. It should also be pointed out that in speech there is no unambiguous equipotential surface, since the airflow pattern changes with the speech sound. In a mask design not conforming to an equipotential surface, the radiation inertance is minimized by distributing the screen mostly over those surfaces closest to the mouth, so that the screen area tends to vary inversely with the distance from the mouth.
We have been working primarily with masks constructed from standard plastic respiratory masks, modified bv drilling a network of from 15 to 30 holes of from 0.5 to 1 cm2 in the mask wall. We have found Monaghan transparent neoprene masks (formerly Bennett Type A) to be easily modified. For most subjects, the compressible, foam-rubber-filled face seal on this mask provides an airtight closure with considerable jaw mobility. The normal outlet is sealed and the added holes covered by stainless steel wire screen cemented in place. Wire screen mesh ratings tried were 400 mesh, a value often used in respiratory pneumotachographs, 500 mesh and 635 mesh, the finest wire screen available to us at this time. Samples were obtained from two different manufacturers, Newark Wire Cloth and Tetko, though in these fine mesh sizes some suppliers do not make their own wire cloth and it is possible that our samples were made by the same manufacturer. We found that a 1 cm2 hole resulted in a wire screen stiff enough so that screen vibration did not effect the high-frequency response of the pneumotachograph. With this size hole, samples of nylon screening of similar mesh were found to vibrate sufficiently to produce errors in the high-frequency pneumotachograph output. If the cloth was stiffened, as by placing a pointed object near the center under a light pressure, the performance of the nylon screen was similar to the stainless steel screen. Thus, the nonmetallic screen could be used if the high-frequency response was not important, or if the screen was stiffened, as by reducing the size of the holes in the mask.
The resistance of the wire screen to a steady flow was measured using a Manostat rotameter to measure airflow and a Statham model PM 283TC pressure transducer to measure pressure, using both 1 cm2 and 10 cm2 samples. For each sample, the pressure varied linearly with the flow, yielding an unambiguous measurement of flow resistance, equal to pressure divided by flow, for flows up to at least 0.5 liter/sec per cm2. This flow is well above the maximum flow for any mask discussed in this paper. The value of resistance measured for each wire screen type is listed in Table 1. Three samples of the 400-mesh Newark wire screen were tested from lots purchased at intervals of over one year and it was found that the resistance varied as much as 18% between samples. The mean value is listed in the chart. The variation of the resistance of the wire cloth over a single one-square-foot sample was within the measurement error of our system, about 3 or 4%.
Table 1. Flow resistance of fine mesh wire screen
|
Mesh
(wires/in.) |
Wire Diameter
(in.) |
Resistance Per cm2
(cm H2O per liter/sec) |
|
400 (Tetko)
400 (Newark) 500 (Newark) 500 (Tetko) 635 (Tetko) |
0.0010
0.0010 0.0010 0.0010 0.0008 |
2.34
2.83 5.93 6.08 7.14 |
Considering the maximum airflow in speech to be about 1 liter/sec and the maximum allowable mask pressure to be about 0.4 cm H20, or about 5% of the average subglottal pressure, the resistance of a mask to be used in speech should be between about 0.3 and 0.5 cm H20 per liter/sec. (Resistance and inertance in the cm H20, liter/sec units used in this paper are equal to 0.98 times the values in standard cgs units. Compliance would be divided by 0.98.) The lower value might be most useful for the study of high-airflow sounds if a minimum of speech distortion is desired, while most studies of voiced speech might make better use of the higher mask resistance. Such a mask can be constructed by covering an area of about 15 to 30 cm2, depending on the size of the mask, with 500-mesh wire cloth. The 635-mesh cloth gives some small increase in performance but is very much more expensive.
Figure 2 shows a typical hole distribution on the type of mask we have been using most. The normal outlet on the right must be closed and is usually used by us to mount the pressure transducer and handle assembly. A piece of sound absorbent polyurethane foam helps prevent resonances in the chamber formed above the nose. A typical mask having a total hole area of 24 cm2 covered with 500-mesh screen would have a mask resistance of about 0.25 cm H20 per liter/sec.
To increase the resistance of the mask without reducing the net area of the holes, one can increase the number of layers of screen at each hole. The high-resistance masks presently used in our laboratory are similar to the one in Figure 2, but have two layers of 500-mesh wire screen, one inside the mask and one outside. The resistance for a 24 cm2 mask would thus be doubled to 0.5 cm H20 per liter/sec.
The acoustic distortion
caused by these masks is small enough to be acceptable for most research or
clinical applications. The test results reported previously (Rothenberg 1973)
for a 400-mesh mask having somewhat less hole area, and therefore a higher radiation
inertance, showed that the formants in voiced speech changed very little, generally
decreasing up to about 5%. A higher resistance mask can also cause a significant
increase in formant damping.
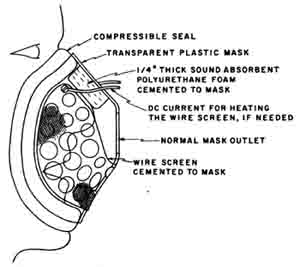
Figure 2. Typical hole distribution on a modified Monaghan respiratory mask.
If the pneumotachograph mask is to be used for only low-frequency airflow measurements, as for measuring the average airflow during one or more phonemes, then the pressure transducer can be mounted some distance from the mask and connected to the inside of the mask by a long tube. The tube can be connected to a fitting in the far end of the mask, at the normal exhaust port, or it can be connected to a hole at the side of the mask. It is only necessary that if the pressure tap is directly in front of the mouth, it be protected by some type of barrier from the direct force of the breath-stream, especially during labial or dental sounds with a high flow velocity, such as the release of an aspirated bilabial stop. (A pressure tap should ideally be perpendicular to the local flow direction.) In this type of application it is not necessary to use a true differential pressure transducer, since the pressure variation on the outside of the mask is very small at low frequencies.
The response of the mask at high frequencies is ultimately limited by the dimensions of the mask. For a mask the size of the one in Figure 2, the maximum difference between the distances from the mouth to the various exhaust holes is on the order of 2 or 3 cm. This distance is equivalent to a transit time error of about 0.1 msec, which would affect the frequency response above about 2000 Hz. A more significant practical limitation in the high-frequency response has been found to be the difficulty in measuring the average differential pressure across the wire screen. At frequencies much above 100 or 200 Hz, the pressure variations outside the mask due to the radiation impedance can no longer be neglected. To subtract the pressure outside the mask (at the outer surface of the wire screen), one can conceivably use a single differential pressure transducer, mounted for example in the normal outlet of the mask. However, it has been found that with this configuration the pressure picked up in the outside port of the differential pressure transducer tends to be greatly attenuated with respect to the pressure at the wire screen, due to the radiation pattern outside the mask, with a resulting distortion at high frequencies. A method used previously to circumvent this attenuation involved picking up the inside and outside pressures with separate microphones and increasing the gain in the outside microphone channel (Rothenberg, 1973).
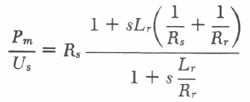
It is also possible to compensate for the pressure
outside the screen due to the radiation impedance by means of the simple electrical
network shown in Figure 3. The transducer T in the
figure is a nondifferential pressure transducer measuring only the internal
mask pressure Pm. Referring back to Figure
1, rough calculations show that for masks such as those discussed in this paper
having mesh sizes of 500 or more and mask walls of 1/16
inch or less, the hole parameters Rh and Lh
can be neglected. The resulting equivalent circuit for the mask can be easily
shown to have a transfer function
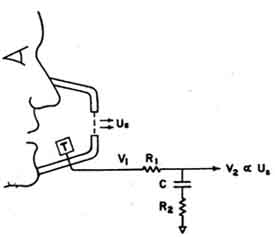 |
Figure 3. Circuit compensating for the pressure outside of the mask due to the radiation impedance. |
|
|
2 |
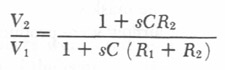
The RC network shown in Figure 3 can be similarly shown to have a transfer function
|
|
3 |
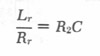
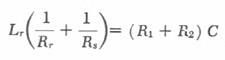
These two transfer functions cancel, to result in a net transfer function of Rs, if
|
|
4 |
| and |
|
5 |
Analytical expressions for Lr and Rr , assuming some simple geometries, are summarized by Flanagan (1972). Using the approximation of an infinite baffle having a single circular hole with an area At equal to the total area of the network of holes in the mask, we may write
|
|
6
|
|
|
7 |
where At is in cm2 and Lr and Rr are in liter/sec, cm H20 units.
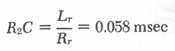
For a mask area of 28 cm2, and a mask resistance of 0.3, as used for the test of response time described below, we compute Lr = 1.1 x10⁻⁴ and Rr = 1.9. Therefore
|
|
8 |
| and |
|
9 |
Note that for this mask, if the desired mask response time is more than about 0.3 msec, the radiation resistance Rr can be neglected, and the resistance R2 of the compensating network set to zero, with R1C » Lr/Rs. For most mask configurations, this can be considered the primary time constant of the correction network.
EXPERIMENTAL DETERMINATION OF MASK RESPONSE TIME
The dynamic characteristics of one mask were measured
using the apparatus shown in Figure 4. Short pulses of airflow
were produced by a circular vibrating aluminum disc, having an effective area
of about 10 cm2, and transmitted to the mask through a mounting plate
and compressible foam rubber seal. The displacement of the disc was monitored
by a specially constructed electronic system which measured the reciprocal
of the capacitance C between the moving plate and a fixed plate. For
parallel plates and small separations, 1/C is closely proportional
to displacement. The displacement sensor output was used in a conventional feedback
arrangement (the subtractor and lead filter in Figure 4),
to produce a disc displacement following closely the output of the waveform
generator, v1. The feedback arrangement made possible disc
response times of less than 0.5 msec without the ringing in the response that
would normaly result from the mechanical resonance of the vibrator armature.
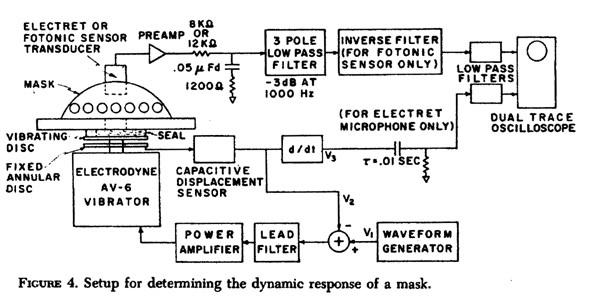
Since the volume velocity generated by the movement of the disc is proportional to the derivative of the disc displacement, the volume velocity waveform, v3 in the figure, was obtained by electronically differentiating the displacement waveform. For example, to produce pulses of airflow, the actual motion of the diaphragm was made to be a step function, as in a square wave.
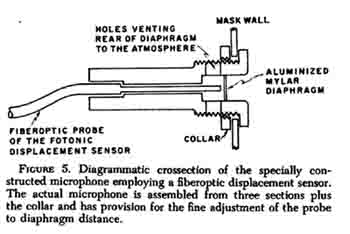
The mask was tested with two types of pressure transducers. An electret capacitance microphone gave a flat frequency response to well above the frequencies of interest, though it did not register the DC airflow because of its inherent limitation at low frequencies: –3 dB at 20 Hz for the microphone used. The specially constructed microphone shown diagramatically in Figure 5 was developed to provide a flat frequency response from zero to over 1000 Hz. The probe of a Fotonic fiberoptic displacement transducer was used to measure the pressure-induced vibrations of the aluminized mylar diaphragm. The upper frequency limitation is imposed by the diaphragm resonance, which was about 1480 Hz in the transducer used in this test, and 3200 Hz in the version used for the measurements reported below under “Some Applications.” The shank enclosing the fiberoptic probe is also convenient to use as a handle for holding the mask to the face.
Neither of the transducers were used as a true
differential pressure transducer, and so each required the compensation network
shown in Figure 3. The electret microphone, due to its construction,
could measure only the pressure inside the mask. The Fotonic sensor transducer,
though constructed with the rear of the diaphragm vented to the atmosphere,
was mounted with its rear ports too far from the wire screening to pick up more
than a small proportion of the pressure just outside the screening. (The pressure
distribution within the mask is more uniform, and so the distance between the
screening and the forward port of the transducer caused only a small error.)
In practice, however, the differential construction of the Fotonic sensor transducer
is advantageous in that it would be effective in cancelling low-frequency ambient
noise, as might be caused by door closures or air conditioning. It can also
be shown that the part of the voice signal outside the wire screen that does
reach the outside port of the transducer results in a proportionate decrease
in the primary time constant of the compensation filter, R1C.
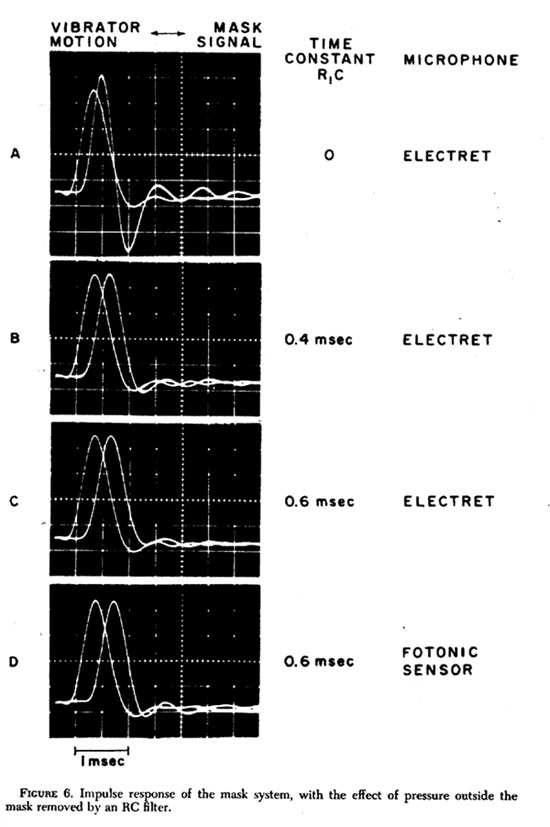
The response of the mask system to a brief pulse of flow is shown in Figure 6. With each mask signal is also shown the estimate of the flow pulse obtained by differentiating the displacement of the vibrating diaphragm. To eliminate high-frequency noise, all signals were low-pass filtered above about 2 kHz with identical filters (Multimetrics AF220, in the time delay filter mode). All mask signals were also filtered by a three-pole linear-phase low-pass filter, –3 dB at 1000 Hz. For frequencies below about 1500 Hz, this filter would approximately compensate for the rise in frequency response caused by the acoustic system between the vibrator diaphragm and the screen of the mask (discussed further below).
When the Fotonic sensor transducer was used, a special “inverse filter” was used to compensate for the mechanical resonance of the transducer diaphragm. This filter inserted a pair of complex-conjugate zeros, or antiresonance, at the frequency and damping of the diaphragm resonance. It was adjusted by observing the pulse response on the oscilloscope and adjusting for minimum ringing at the resonance frequency. The obligatory two poles of this filter required for realizability were placed well above the frequency range of interest.
When the electret microphone was used, an RC high-pass filter with a –3 dB frequency of 20 Hz was used in the diaphragm channel, to mirror the equivalent characteristic of the electret microphone.
The mask waveform in Photo B of
Figure 6 was obtained using the time constants R1C
= 0.4 msec and R2C = 0.06 msec that were computed
in Equations 8 and 9 for an approximation to the mask used. When the
primary filter time constant, R1C, was adjusted
for what seemed to be a best match to the vibrator diaphragm signal, the waveforms
C and D resulted. The resulting compensator time constant, 0.6 msec, was about
50% higher than the computed values. To assist in waveform comparisons,
for each transducer the oscilloscope gain controls were set to approximately
equalize the heights of diaphragm and mask signals. The gain ratios used for
R1C = 0.6 msec were approximately those that would
result in a proper calibration, that is, ratios that would equalize the
low frequency responses of the two channels. For R1C
= 0.4 msec, the gain of the mask signal was reduced about 20% from the proper
value, and for R1C = 0 the mask signal was
reduced by about 50%. The waveforms for the 0.4 msec and the no compensation
conditions are shown only for the electret microphone, however the Fotonic sensor
microphone gave similar results. A value of 0.6 msec was subsequently used for
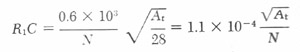
this rnask. For masks having an area other than 28 cm2 (and
a 500-mesh screen), or more than one layer of wire screen, the proper time constant
can be computed:
|
|
10 |
where At is the new area, and N the number of layers of wire screen.
A comparison of the diaphragm and mask waveforms for R1C = 0.6 msec shows that the mask system fidelity was roughly 0.2 msec, which would be equivalent to a frequency response flat to at least about 1000 Hz. The frequency response of the system was checked by using a sinusoidal waveform for the vibrator, instead of a square wave, and found to be flat to about 1200 Hz, ±2 dB.
SCREEN TEMPERATURE
In a typical wire screen pneumotachograph used for respiratory measurements, the screen is located within a passageway coming from the exhaust port of the mask. In this configuration, the fine mesh of the screening would soon be partially occluded with condensed moisture from the breathstream if it were not preheated to above body temperature, usually by passing an electrical current through the wire screen. Klatt et al. (1968) and Hixon (1972) have also reported adding a “bias” flow of dry air for preventing condensation (and for reducing the rebreathing of expired air). With the more open construction of a circumferentially vented mask, little or no condensation is evident within the mask and on the screen during normal speech, and therefore it may not always be necessary to elevate the screen temperature or introduce a bias flow. To make clear the conditions under which such measures are necessary, two mask configurations were supplied with saturated air at near body temperature, and the increase in mask resistance recorded as a measure of moisture condensation.
The larger mask is the one presently used for most flow measurements in this laboratory. It was constructed from a large-size Monaghan respiratory mask covering both the mouth and nose. The total hole area was about 25 cm2, with the screening at a distance from the mouth ranging from about 1.5 to 3.5 cm. The holes were covered with two layers of 500-mesh stainless steel wire screen, one inside the mask and one outside. The net screen resistance was measured to be 0.48 cm H20 per liter/sec.
The smaller mask was specially constructed of acrylic plastic to cover only the mouth, with a dead space of only about 35 cm3, and a screen area of 16 cm2 ringing the mouth at a distance from the mouth opening of between 1 and 2 cm. The holes were covered with one layer of 500-mesh wire cloth, with a net resistance of 0.35 cm H20 per liter/sec.
The air was bubbled through heated water, then passed through a transparent plastic tube. The air temperature at the end of the tube was monitored with a thermocouple, and the saturation monitored by the presence of water condensation throughout the length of the tube. Excess condensate was drained by means of a trap near the end of the tube. Room temperature was between 65ş and 70ş F with a relative humidity of about 25%. The air entered the mask through a molded plastic “face”, through a hole of size and location similar to that of the mouth. The DC airflow was monitored by a rotameter on the dry side of the flow path.
The mask resistance was measured by superimposing a 0.6 liter/sec peak-to-peak 10-Hz sinusoidal flow component on a DC flow of 0.3 liter/sec. The amplitudes were selected to roughly simulate breathy voicing. The AC flow was introduced by coupling to the inside of a loudspeaker enclosure via a T connection in the condensing tube. The amplitude of the 10-Hz component picked up by the mask pressure transducer was proportional to the mask resistance. The effect of the air temperature on the transducer sensitivity was checked and found small.
The moist air was heated to 100şF (body temperature) and 110şF. The higher temperature simulated a room temperature which was 10ş less than the actual, with a somewhat higher room relative humidity. When heated with an electrical current, the steady state screen temperature (with no airflow) was measured with a small thermocouple touching the screen.
After the introduction of the moist air, the screen resistance would increase approximately exponentially, with a time constant of about 10 msec. Table 2 shows the percent increase in the screen resistance after a steady state had been attained for the various test conditions. In actual speech, the error due to the breath moisture would be somewhat less than the values in the table, due to the averaging that occurs over periods of expiratory and inspiratory airflow. In addition, the breath temperature is always at least 5şF less than the body temperature, so that the errors indicated in the table are quite conservative.
|
Mask
|
Air
Temperature (F) |
Heating
Current (amp/cm) |
Screen
Temperature (F) |
Increase in
Mask Resistance (%) |
|
Large
Large Small Small Small Small |
100
110 100 110 110 110 |
0
0 0 0 0.25 0.5 |
Room
Room Room Room 75-80 85-95 |
7
15 19 24 12 1 |
We might conclude that in a normal laboratory atmosphere and with 500-mesh screening, a mask of a size similar to that of the large mask need not be heated, and the error due to condensation for a size similar to that of the small mask would be no more than 5 or 10%. When heating is necessary, a current of about 0.5 amperes per centimeter of screen width (equivalent to 0.2 watts/cm2 for 500 mesh) would be sufficient.
SOME APPLICATIONS
Conductance of a Vocal Tract Constriction
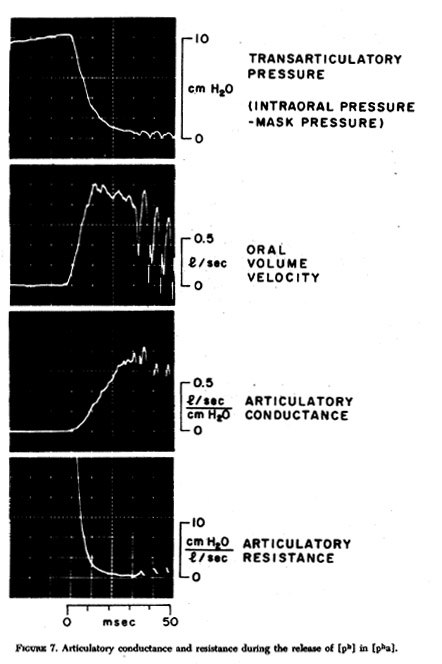
Though the improved acoustic transmission properties of a circumferentially vented mask make it of value in measuring the average airflow during one or more consecutive phonemes, the short response time possible with this type of mask makes it especially desirable when the pattern of airflow within a phoneme is of interest. For example, to follow the airflow variations during the release of a stop, a response time of approximately 3 to 5 msec is necessary. Figure 7 shows the airflow during the release of the [ph] in [pha], produced in isolation, at a volume a little above a normal conversational level, by an adult male speaker. The intraoral pressure was recorded simultaneously by a means of a Pitron pressure transducer via a two-inch-long tube into the corner of the mouth. The response of the Pitron transducer, including the tubing, was flat to at least 500 Hz, as was also the mask system used for flow measurement. However, the frequency response in both the pressure and flow channels was limited by identical four-pole linear-phase low-pass filters with response times of just under 2 msec (–3 dB at 150 Hz). A small time delay was also added electronically in the pressure channel to compensate for the unequal path lengths to the flow and pressure transducers. The traces in the figure are that of the pressure across the lip opening (intraoral pressure minus the mask pressure as obtained from the flow channel), the airflow, and the conductance G and resistance R of the opening at the articulators as they separate, as computed from the flow divided by the pressure, and pressure divided by flow, respectively. The division was accomplished by an analog multiplier integrated circuit (Analog Devices type AD532) in a standard feedback configuration used for division. The traces for G and R are not shown in those intervals in which the denominator falls below the minimum allowable for the divider circuit. (Integrated circuit modules designed explicitly for division are now available which give far more accuracy at small values of the denominator and would result in much smoother and more complete traces.)
The traces for conductance and resistance show
that the opening of the articulators occurred within about 20 to 25 msec, even
though the flow reaches its peak in about 12 msec. (The zero of the time scale
is placed at the first instant of articulator airflow.) The conductance trace
is of special interest in that it is approximately proportional to the variation
of the area of the lip opening. It can be seen, for example, that the initial
separation of the lips was not very abrupt, and that the articulatory opening
movement was completed with a small “overshoot”, that is, the conductance,
and therefore the area of the opening, reached a peak value slightly higher
than the final value during the vowel. The continuation of the conductance and
resistance traces into the vowel illustrates how these properties can be measured
accurately even during voicing, if the pressure and flow are sampled during
each glottal pulse near the time of the maximum flow.
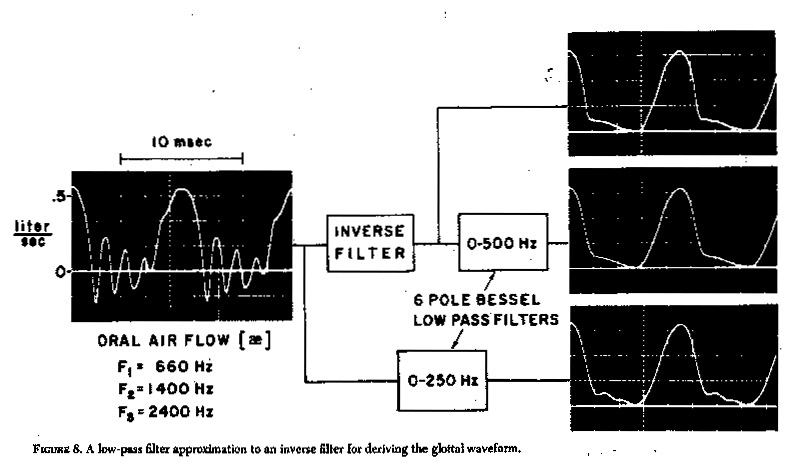
Low-Pass Approximation to an Inverse Filter
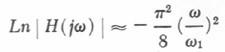
The method used for Figure 7 is adaptable to measuring the pattern of movement at articulatory constrictions other than at the lips, if care is taken to account for differences in the time delays caused by the orifice-to-transducer path lengths, and to remove, by suitable filtering, the acoustic effects of these paths. A filter that has a transfer characteristic the inverse of that of the acoustic system being canceled, or compensated for, is often referred to as an inverse filter. If the acoustic system between the constriction and the transducer (whether for pressure or airflow) can be approximated by a fairly hard-walled tube of uniform cross section, then the appropriate inverse filter has been widely discussed in the literature. The transfer function of the tube is a series of complex pole pairs (resonances) of increasing frequency, and the inverse filter a series of corresponding complex zero pairs (antiresonances) at the pole frequencies. However, if the tube length is short compared to a wavelength at the highest frequency of interest, a simple low-pass filter can be used for the inverse filter. The equations describing the low-pass approximation to a series of complex zero pairs at frequencies generated by a uniform tube closed at one end is described by Fant (1960) and Flanagan (1972). They actually describe the high-pass approximation to a series of complex pole pairs, but we need only to invert the derived transfer function for the solution to our problem. For a system with low damping, a low-pass compensation filter should have a linear phase characteristic, with the logarithm of the magnitude of the transfer function given by:
|
|
11 |
where w1 is the lowest resonance of the system being compensated.
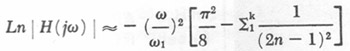
If the lowest k resonances of the system are compensated by a proper inverse filter consisting of pairs of complex conjugate zeros, and only the k + 1 and higher resonances are to be removed by low-pass filtering, then
|
|
12 |
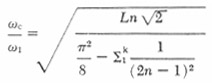
The –3 dB frequency of this filter, wc, is related to w1 by:
|
|
13 |
For example, consider a uniform three inch long tube leading to the stiff termination of a pressure transducer diaphragm. The lowest resonance is near 1000 Hz. (At a speed of sound of 12 in./msec, 3 in. is Ľ wavelength at 1000 Hz). From Equation 13, with k = 0, we compute wc/w1 = 0.53. Therefore, a lowpass filter with a –3 dB point at about 530 Hz could be used. We have found that a three-pole Bessel filter works well, though a filter of order higher than three would result in a better rejection of the tube resonances. The resulting approximation should be good to within 2 or 3 dB to about 700 Hz. (Care should be taken, however, that there is no large discontinuity in area between the tube and the pressure chamber of the transducer. If there is a discontinuity, the inverse filter required becomes more complex.)
The same type of low-pass filter could also be used as a compensating filter for the mask signal when the airflow is to be measured at some point in the vocal tract other than the lips. The “tube” to be compensated for is the path from the point of interest to the lips (or more precisely, to the mask screen). When computing the resonances of this portion of the vocal tract, the tract is considered completely closed at the point of interest (no matter what the actual area is at that place). For example, again using Equations 11 and 13, the filter for measuring airflow at the center of the palate would have a –3 dB frequency of about 800 Hz, since the path length from that point to the lips is about two inches. It is assumed that there is no constriction between palate and the lips narrow enough to invalidate the uniform tube assumption.
An approximation to the airflow at the glottis can also be obtained by the same type of low-pass filtering, if there is no constriction in the half of the vocal tract closest to the lips. This assumption is equivalent to assuming an average or higher than average first formant and holds best in English for the vowels /a/ and /ć/. A typical adult male vocal tract having “neutral-vowel” resonances at about 500, 1500, 2500,… Hz would require a –3 dB frequency of about 250 Hz, and the approximation would be valid to at least 400 Hz, or up to 500 Hz if a vowel with a high first formant is used. For the shorter vocal tract of an average adult female speaker, the frequencies would be about 20% higher.
Figure 8 shows an example of the
glottal airflow during a vowel /ć/, as obtained by low-pass filtering alone,
and by a more conventional inverse filter having three pairs of complex zeros
that were adjusted to cancel the formant frequency oscillations during the most-closed
portion of the glottal cycle (Rothenberg, 1973). In the center photo at the
right, the “true” glottal airflow from the conventional inverse filter
is shown low-pass filtered at 500 Hz, –3 dB. Except for some slight remanent
oscillations at the frequency of the first formant, it can be seen that the
waveform obtained by low-pass filtering the mask waveform at 250 Hz was similar
to that obtained by low-pass filtering the true waveform at 500 Hz. In terms
of response time, low-pass filtering the mask waveform at 250 Hz results in
an approximation to the glottal wave with a response time limited to about 1.5
msec (the response time of the low-pass filter at 500 Hz).
Laryngeal Frequency
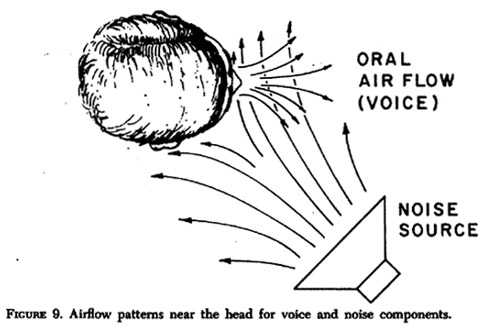
A circumferentially vented mask is also useful for extracting laryngeal frequency during voicing or identifying periods of voicing. In these applications, either oral volume velocity or oral point velocity (from a velocity-sensing microphone) yields a better signal than the radiated acoustic pressure. This is true whether laryngeal frequency is measured as the periodicity of the entire waveform, or of just the fundamental frequency component. The advantage occurs from a reduction in the sensitivity to low-frequency ambient room noise, including sounds from other voices, and transducer noise. Since the transducer noise in radiated pressure measurement can be reduced by better electronics, and by placing the microphone very close to the mouth, we will consider only the ambient room noise.
When the glottis is closed sufficiently for voicing, the mouth tends to appear to ambient room noise as a high impedance at the lower harmonics of the fundamental frequency. Thus, as illustrated in Figure 9, at those frequencies the airflow component near the mouth due to the noise will tend to be perpendicular to the component due to oral airflow. Consequently, a (direction sensitive) velocity or volume velocity sensor near the mouth that is oriented in the direction of the oral flow will pick up little of the ambient noise component. A pressure-sensitive microphone, on the other hand, will respond equally to both the voice and the ambient noise.
Figure 10 shows a comparison
between fundamental frequency extraction from the oral volume velocity signal
from a pneumotachograph mask and from the output of a high-quality capacitance
microphone (Sennheiser MKH110) placed just outside the pneumotachograph mask.
To emphasize the fundamental frequency component for an adult male speaker,
both signals were highpass filtered, –3 dB at 75 Hz (–12 dB/octave),
and low-pass filtered, –3 dB at 200 Hz (–24 dB/octave, linear phase),
before being applied to the fundamental frequency analyzer. In addition, the
microphone signal was integrated, to produce a signal equivalent to volume velocity
(below 2 or 3 kHz the volume velocity at the mouth is very nearly the integral
of the pressure) and normalized to an amplitude similar to that of the mask
signal. The fundamental frequency analyzer measured the period between the positive-going
zero crossings of the input signal and produced as a measure of fundamental
frequency a DC voltage proportional to the reciprocal of this period. This output
voltage was held until the next positive-going zero crossing, then reset to
the reciprocal of the new period. If no new positive-going zero crossing occurred
within 20 msec, the output was set at a level meant to indicate “no voicing.”
The filtered waveforms and the analyzer output were recorded on an FM tape recorder
and played back at a lower speed for the chart recorder.
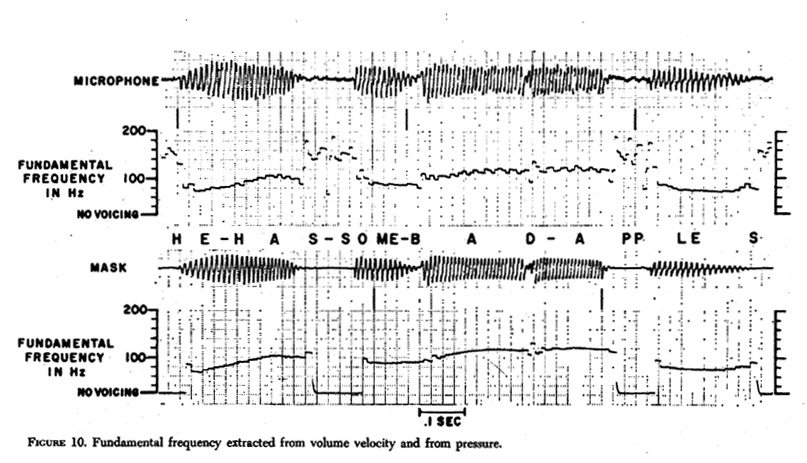
The sentence “He has some bad apples” was spoken at a normal conversational level by a male adult, with a background noise consisting of a recording of a prolonged vowel /a/, from a loudspeaker about five feet away. The sound level near the mask from the interfering signal was about 20 dB below the average vowel level in the speaker’s voice and simulated the interference possible from a person speaking from three to five feet from the microphone. A smaller amount of ambient room noise was also present from the tape recorder mechanism, room ventilation, and so on.
To reduce the analyzer response to small noise fluctuations when no voicing is present, a DC offset was added to the analyzer input. The offset was set at about 10% of the peak voltage during a typical vowel. For the mask signal, this setting was not at all critical, with settings of 5, 10, and 20% yielding similar results, including a clear separation between voiced and unvoiced intervals. For the microphone signal, a setting of 30% of the peak vowel voltage would result in more reliable detection of intervals of no voicing; however, the accuracy of fundamental frequency measurement was degraded, with glottal periods missed when the voice level was low.
The mask signal in the figure shows little or no sign of the interfering signals. The fundamental frequency extraction appears to be consistent and precise, with irregularities only occurring at the onset or offset of voicing and at the release of the voiced stops /d/ and /b/. Testing with higher levels of the interfering signal showed that the mask reduced the interference by at least 30 dB, or about 25 dB after an allowance is made for the microphone being slightly closer to the mouth when no mask is in place. Fundamental frequency extracted from the microphone signal, as would be expected, is less precise, with errors of about 5% typical.
ACKNOWLEDGMENT
This work was supported by Public Health Service Research Grant NS-08919 from the National Institute of Neurological and Communicative Disorders and Stroke.
REFERENCES
Beranek, L. H., Acoustics. New York: McGraw-Hill (1954).
Fant, G., Acoustic Theory of Speech Production. S–Gravenhage: Mouton (1960).
Flanagan, F. L., Speech Analysis Synthesis and Perception. (2nd ed.) Berlin: Springer-Veriag (1972).
Hixon, T. J., Some new techniques for measuring the biomechanical events of speech production: One laboratory’s experiences. In Proceedings of the Conference of Orofacial Function: Clinical Research in Dentistry and Speech Pathology: ASHA Reports 7. Washington, D.C.: American Speech and Hearing Association, 68-103 (1972).
Klatt, D. H., Stevens, K. N., and Mead, J., Studies of articulatory activity and airflow during speech. In A. Bouhuy (Ed.), Sound Production in Man, Ann. N. Y. Acad. Sci., 155, 42-55 (1968).
McKinney, N. P., Laryngeal Frequency Analysis for Linguistic Research. Report No. 14. Ann Arbor: Communication Sciences Laboratory, Univ. of Michigan (September 1965).
Rothenberg, M., A new inverse-filtering technique for deriving the glottal airflow waveform during voicing. J. Accoust. Soc. Am., 53:6, 1632-1645 (1973).
Van den Berg, J., Modern research in experimental phoniatrics. Folia Phoniat., 14, 81-149 (1962).
|
|